Fig. 7.
Download original image
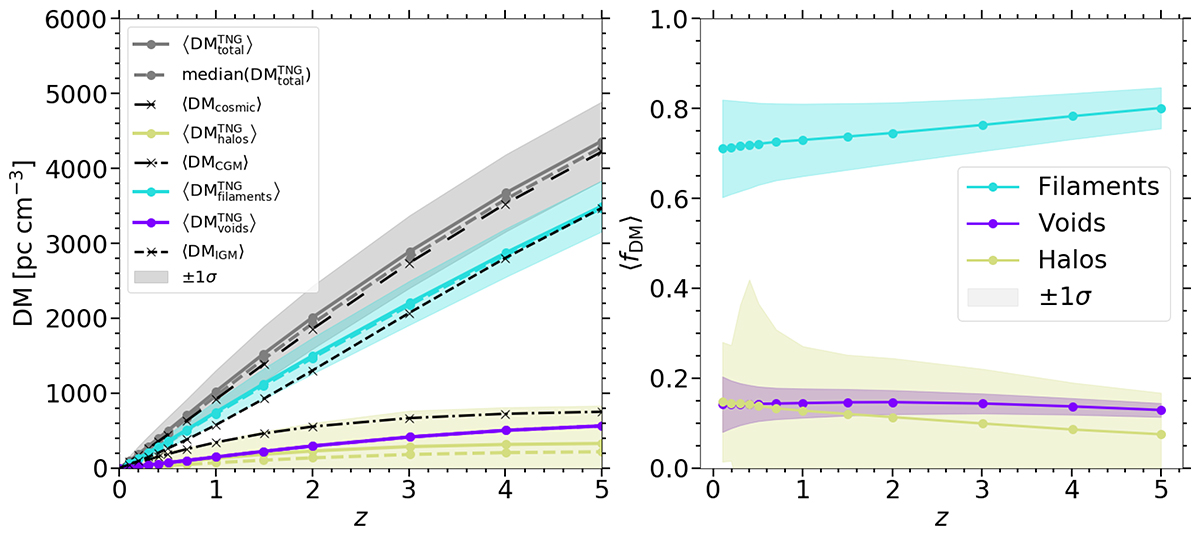
Redshift evolution of DM contributions as a function of large-scale structure. Left panel: mean, median, and standard deviation around the mean of the DM–redshift relationship for TNG300-1 halos (![]() ; yellow), filaments (
; yellow), filaments (![]() ; cyan), and voids (
; cyan), and voids (![]() ; purple) derived using our metric. These are compared to the ⟨DMcosmic⟩ subcomponents (see Sect. 6.1): ⟨DMIGM⟩ (dashed black line) and ⟨DMCGM⟩ (dot-dashed black line). Right panel: means (coloured lines) and standard deviations (shaded regions) of the equivalent fractional DM contributions ⟨fDM⟩ accumulated due to traversing each type of structure by our FRBs originating at given redshifts.
; purple) derived using our metric. These are compared to the ⟨DMcosmic⟩ subcomponents (see Sect. 6.1): ⟨DMIGM⟩ (dashed black line) and ⟨DMCGM⟩ (dot-dashed black line). Right panel: means (coloured lines) and standard deviations (shaded regions) of the equivalent fractional DM contributions ⟨fDM⟩ accumulated due to traversing each type of structure by our FRBs originating at given redshifts.
Current usage metrics show cumulative count of Article Views (full-text article views including HTML views, PDF and ePub downloads, according to the available data) and Abstracts Views on Vision4Press platform.
Data correspond to usage on the plateform after 2015. The current usage metrics is available 48-96 hours after online publication and is updated daily on week days.
Initial download of the metrics may take a while.