Fig. 6.
Download original image
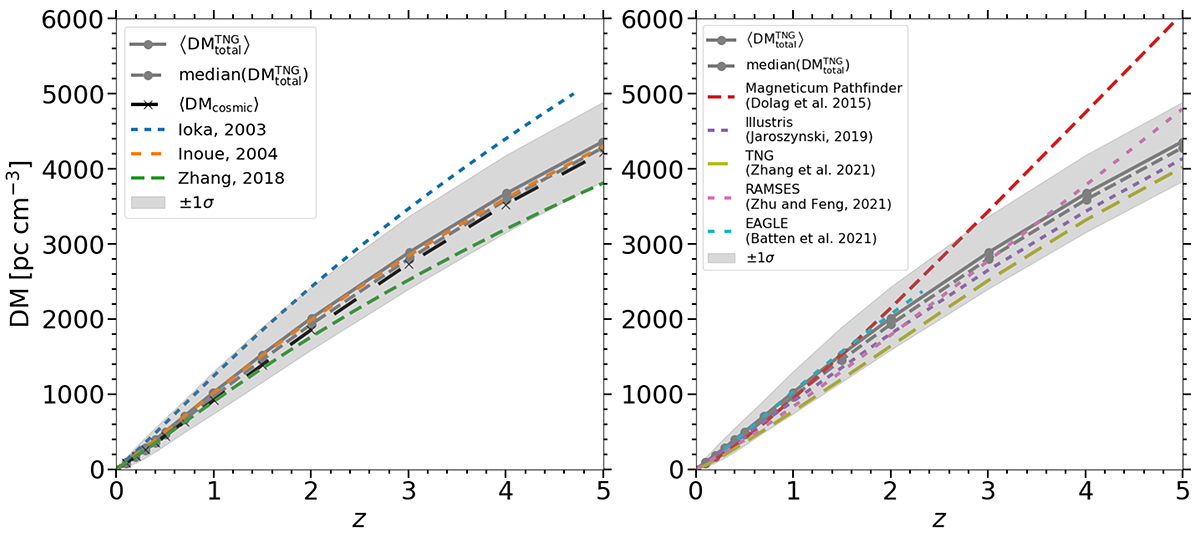
FRB DM evolution with redshift continued. Both panels: average total DM–z relationship derived for TNG300-1. The mean (solid grey line), median (dotted grey line), and standard deviation (shaded grey region) around the mean of ![]() values calculated for our sightlines are shown. Left panel: compared to ⟨DMcosmic⟩ (dashed black line), and the results of analytical studies from the literature (dashed coloured lines). Right panel: compared to results derived from other cosmological simulations in the literature (dashed coloured lines).
values calculated for our sightlines are shown. Left panel: compared to ⟨DMcosmic⟩ (dashed black line), and the results of analytical studies from the literature (dashed coloured lines). Right panel: compared to results derived from other cosmological simulations in the literature (dashed coloured lines).
Current usage metrics show cumulative count of Article Views (full-text article views including HTML views, PDF and ePub downloads, according to the available data) and Abstracts Views on Vision4Press platform.
Data correspond to usage on the plateform after 2015. The current usage metrics is available 48-96 hours after online publication and is updated daily on week days.
Initial download of the metrics may take a while.