Fig. 5.
Download original image
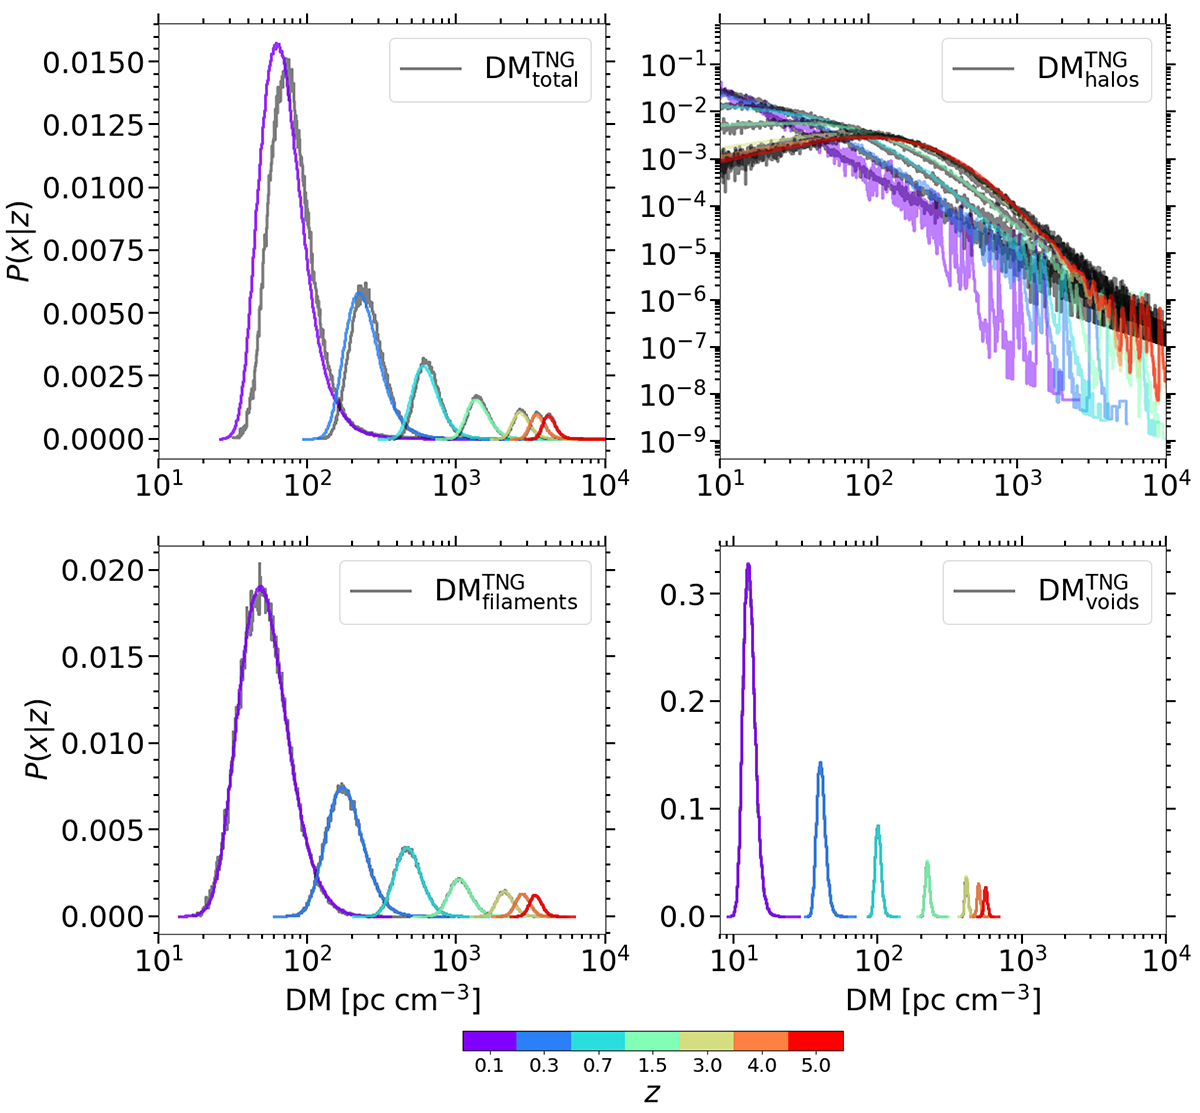
FRB DM evolution with redshift. Clockwise from top left: histogram of the probability distributions (solid coloured lines) of the total cosmological DM (![]() ), and contributions from large-scale structures (
), and contributions from large-scale structures (![]() ,
, ![]() ,
, ![]() ) for FRBs originating at various redshifts (see Table 1 and colour bar), calculated for TNG300-1. For comparison, grey lines are new data drawn from fits to these LSS distributions. These new data are combined to create the comparison histograms for
) for FRBs originating at various redshifts (see Table 1 and colour bar), calculated for TNG300-1. For comparison, grey lines are new data drawn from fits to these LSS distributions. These new data are combined to create the comparison histograms for ![]() . The slight mismatch between our low-redshift TNG data and drawn
. The slight mismatch between our low-redshift TNG data and drawn ![]() values arises due to the fact that our fits slightly overestimate the probability of sightlines containing very high (≳103 pc cm−3)
values arises due to the fact that our fits slightly overestimate the probability of sightlines containing very high (≳103 pc cm−3) ![]() contributions at low redshifts.
contributions at low redshifts.
Current usage metrics show cumulative count of Article Views (full-text article views including HTML views, PDF and ePub downloads, according to the available data) and Abstracts Views on Vision4Press platform.
Data correspond to usage on the plateform after 2015. The current usage metrics is available 48-96 hours after online publication and is updated daily on week days.
Initial download of the metrics may take a while.