Fig. 4.
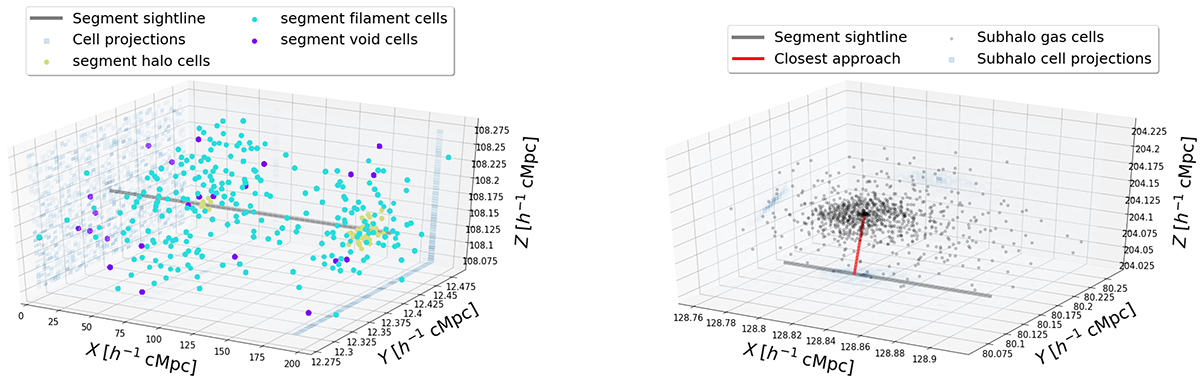
Download original image
Tracing structure along sightlines. Left panel: a (205, 0.2, 0.2) h−1 cMpc line of sight segment traversing a TNG snapshot at z = 0. The grey line indicates the sightline through the segment. Blue squares projected onto the (xy, yz, xz) planes represent the number density of all cells within the segment in the (x, y, z) directions. Dots coloured according to their LSS type represent the central locations of all cells identified as closest to one of the 10 000 bins along the sightline. The sightline is approximated to traverse these cells due to the Voronoi tessellation of the simulation. Right panel: a second sightline complete with the subhalo it traverses and the impact parameter measured between the sightline and subhalo.
Current usage metrics show cumulative count of Article Views (full-text article views including HTML views, PDF and ePub downloads, according to the available data) and Abstracts Views on Vision4Press platform.
Data correspond to usage on the plateform after 2015. The current usage metrics is available 48-96 hours after online publication and is updated daily on week days.
Initial download of the metrics may take a while.