Fig. 10.
Download original image
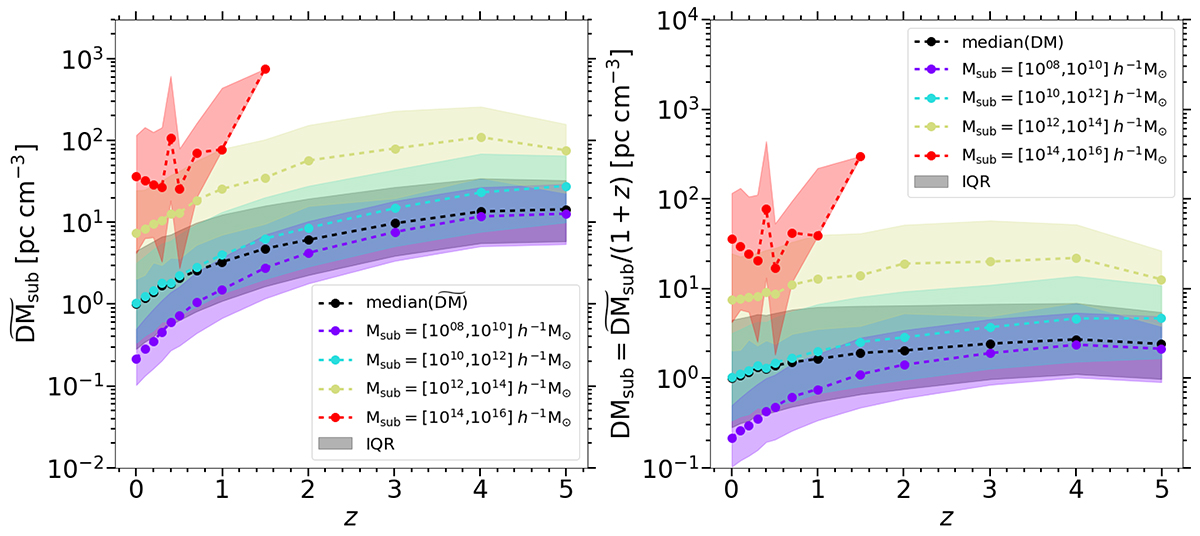
DM accumulated within individual snapshots due to traversing collapsed structures. Left panel: statistics (median, interquartile range) describing the average ![]() accumulated within snapshots by sightlines traversing our subhalos in the rest frames of the snapshots, and therefore the rest frames of the subhalos. Right panel: these values weighted by redshift, effectively describing the average DM that would be observed by an observer at z = 0 due to these subhalos. Colours indicate the mass ranges described in Fig. 9.
accumulated within snapshots by sightlines traversing our subhalos in the rest frames of the snapshots, and therefore the rest frames of the subhalos. Right panel: these values weighted by redshift, effectively describing the average DM that would be observed by an observer at z = 0 due to these subhalos. Colours indicate the mass ranges described in Fig. 9.
Current usage metrics show cumulative count of Article Views (full-text article views including HTML views, PDF and ePub downloads, according to the available data) and Abstracts Views on Vision4Press platform.
Data correspond to usage on the plateform after 2015. The current usage metrics is available 48-96 hours after online publication and is updated daily on week days.
Initial download of the metrics may take a while.