Fig. 4.
Download original image
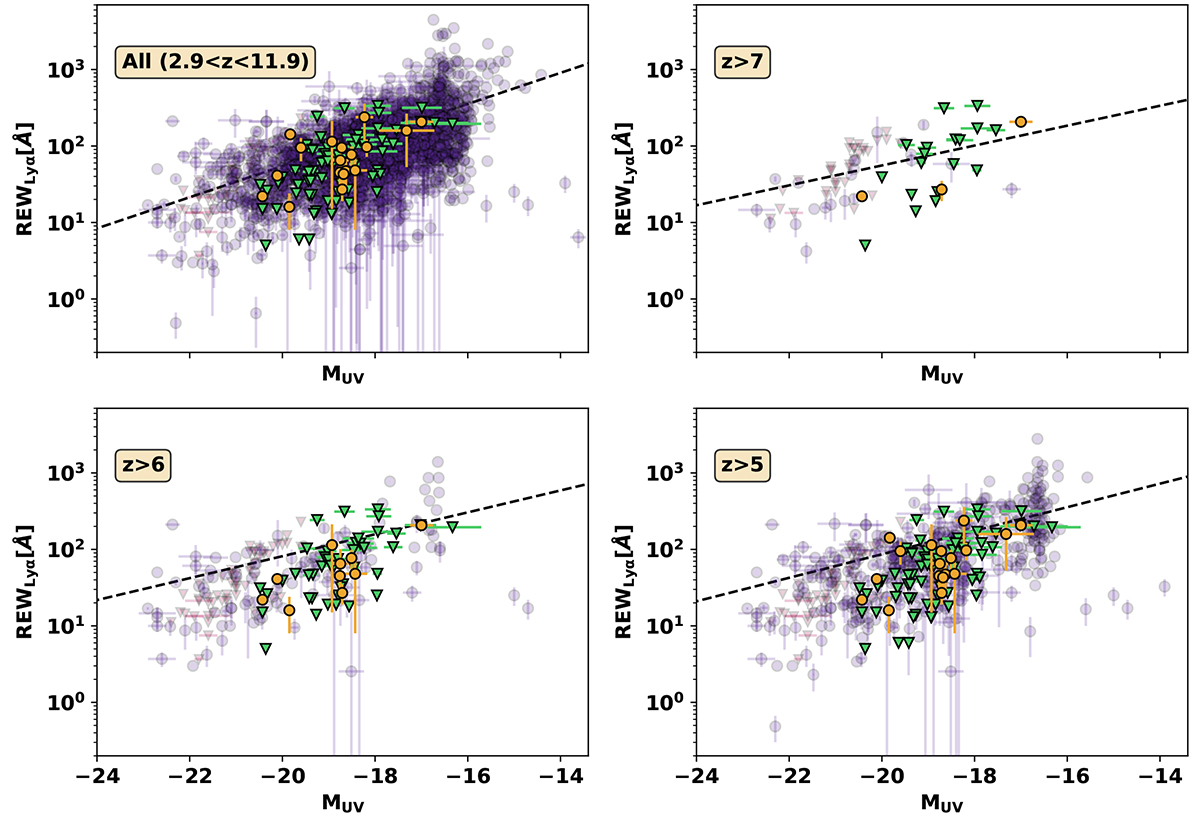
Distribution of Lyα REWs as a function of MUV for our sample (orange circles for detections and green triangles for 3σ upper limits) and from the literature (purple circles for detections and red triangles for 3σ upper limits). An illustrative fit to the detections is shown by the black dashed line. See Appendix E for details of the literature sample.
Current usage metrics show cumulative count of Article Views (full-text article views including HTML views, PDF and ePub downloads, according to the available data) and Abstracts Views on Vision4Press platform.
Data correspond to usage on the plateform after 2015. The current usage metrics is available 48-96 hours after online publication and is updated daily on week days.
Initial download of the metrics may take a while.