Fig. 3.
Download original image
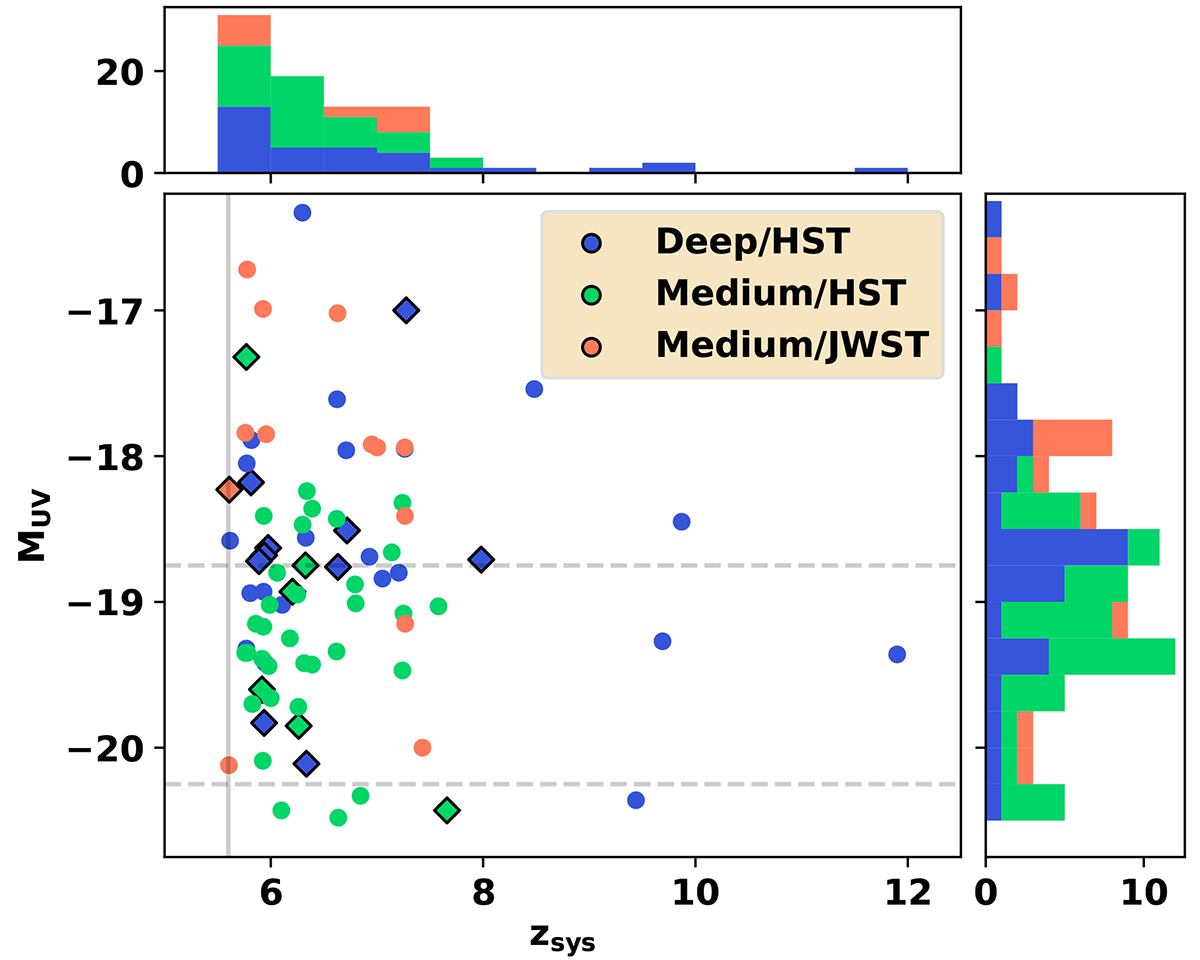
MUV (from NIRSpec spectra; see Appendix D) versus systemic redshift (based on optical lines) for our sample. Galaxies observed in different tiers are coloured differently. Sources detected in Lyα emission are shown as diamonds with black outlines. Horizontal dashed lines show MUV values of −18.75 and −20.25, while the vertical grey line shows our lower redshift cutoff (zsys > 5.6).
Current usage metrics show cumulative count of Article Views (full-text article views including HTML views, PDF and ePub downloads, according to the available data) and Abstracts Views on Vision4Press platform.
Data correspond to usage on the plateform after 2015. The current usage metrics is available 48-96 hours after online publication and is updated daily on week days.
Initial download of the metrics may take a while.