Open Access
Fig. F.1.
Download original image
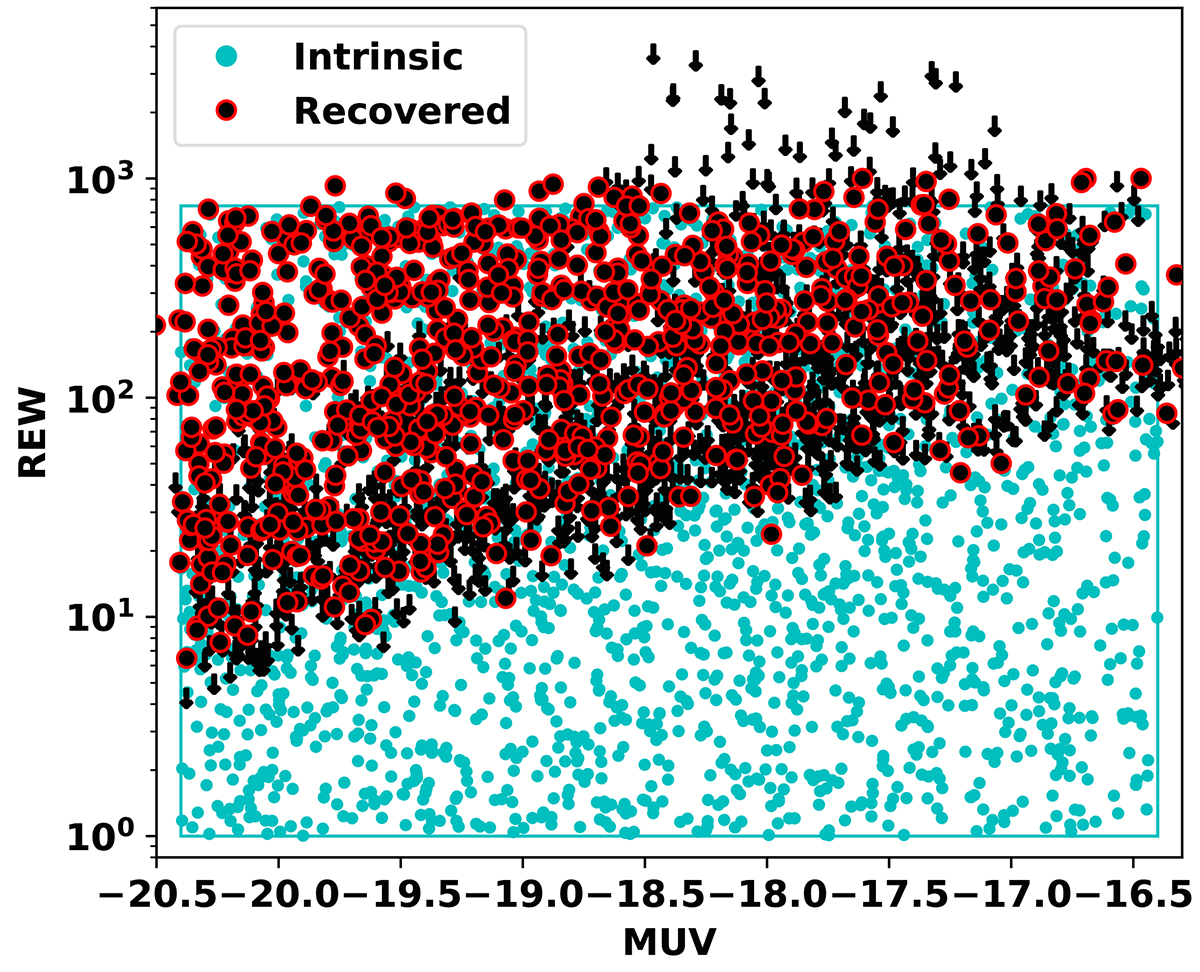
Results of fitting a sample of simulated galaxies. The intrinsic distribution of REW and MUV for the simulated galaxies are shown as cyan circles, with a cyan rectangle outlining the region. The best-fit values and 3σ upper limits are shown as red-outlined circles and black arrows, respectively.
Current usage metrics show cumulative count of Article Views (full-text article views including HTML views, PDF and ePub downloads, according to the available data) and Abstracts Views on Vision4Press platform.
Data correspond to usage on the plateform after 2015. The current usage metrics is available 48-96 hours after online publication and is updated daily on week days.
Initial download of the metrics may take a while.