Fig. 6
Download original image
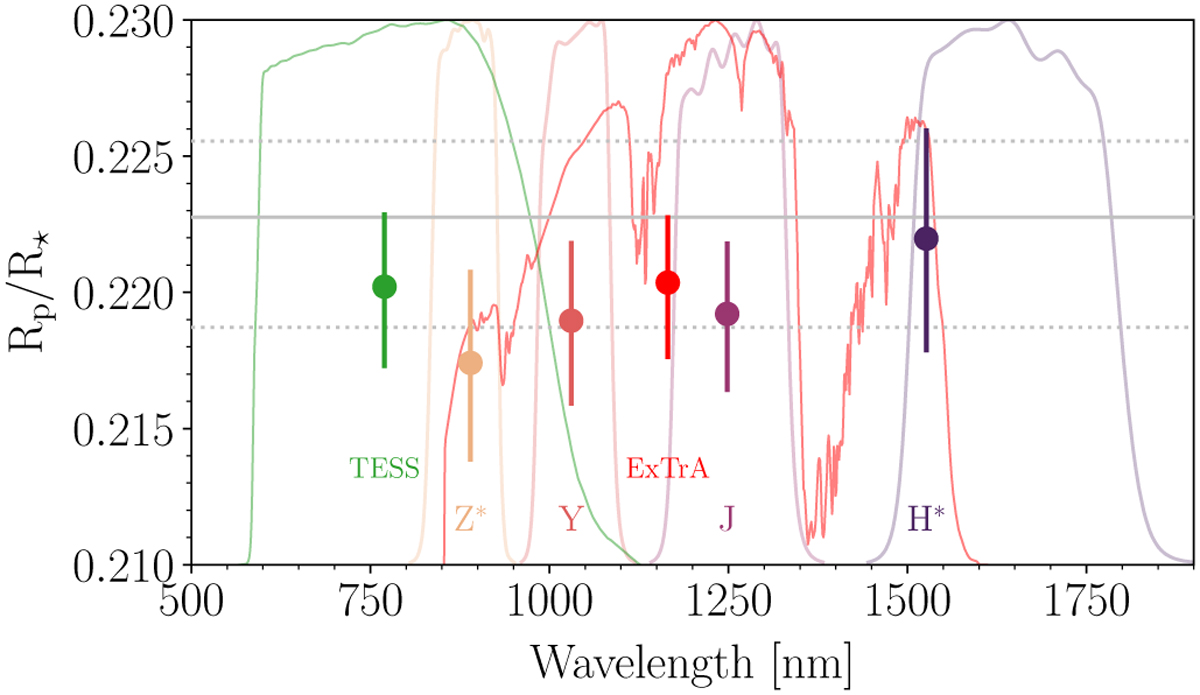
Posterior distribution comparison for Rp/R* (error bars) computed for different bands (shown and labelled with different colours). TESS, ExTrA (0.85-1.55 μm), Ζ*, Y, J, and H* data are fitted jointly with a different Rp/R* parameter for each of the datasets. The horizontal solid and dotted grey lines represent the posterior median and 68.3% CI of Rp/R* inferred in Sect. 4.4.
Current usage metrics show cumulative count of Article Views (full-text article views including HTML views, PDF and ePub downloads, according to the available data) and Abstracts Views on Vision4Press platform.
Data correspond to usage on the plateform after 2015. The current usage metrics is available 48-96 hours after online publication and is updated daily on week days.
Initial download of the metrics may take a while.