Fig. A.1
Download original image
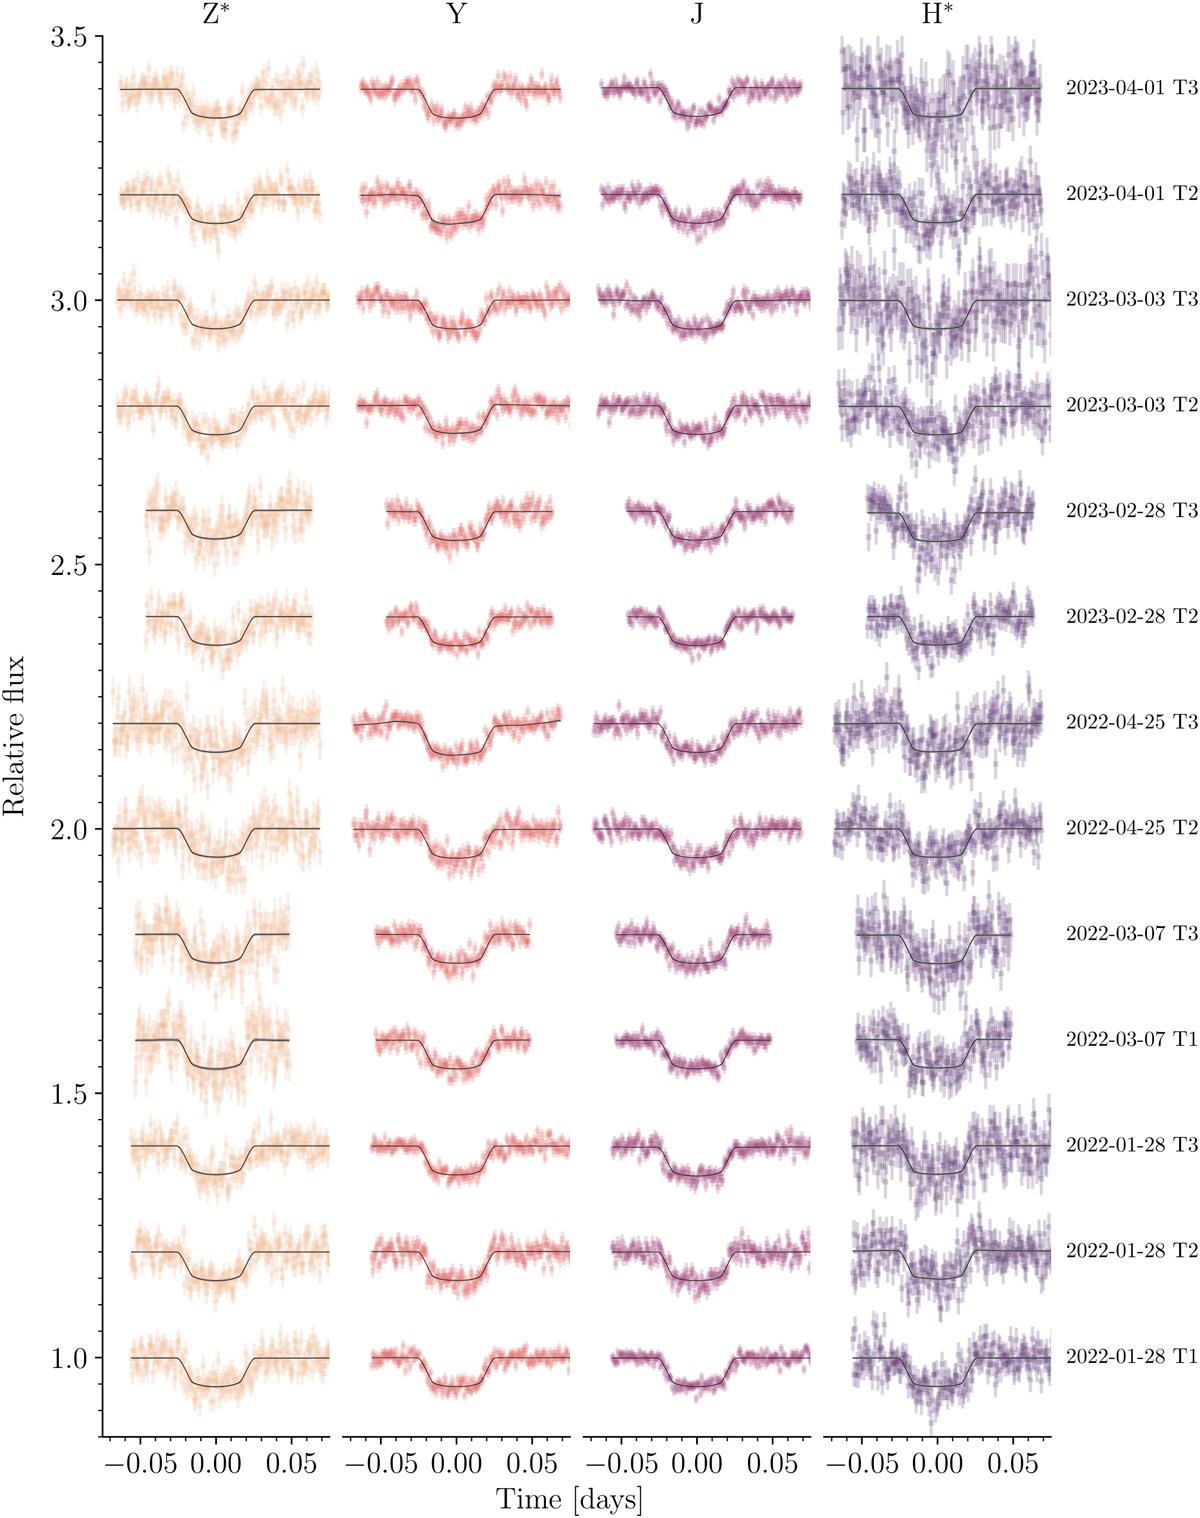
ExTrA transit photometry observations of TOI-4860 b in the Z*, Y, J, and H* bands (error bars). Each line corresponds to a night (with format YYYY-MM-DD) and ExTrA telescope (labelled T1, T2, and T3) observation, which are offset vertically for clarity. For each transit, the median model (black line) and 68% CI (grey band, barely visible) computed from 1000 random posterior samples are shown.
Current usage metrics show cumulative count of Article Views (full-text article views including HTML views, PDF and ePub downloads, according to the available data) and Abstracts Views on Vision4Press platform.
Data correspond to usage on the plateform after 2015. The current usage metrics is available 48-96 hours after online publication and is updated daily on week days.
Initial download of the metrics may take a while.