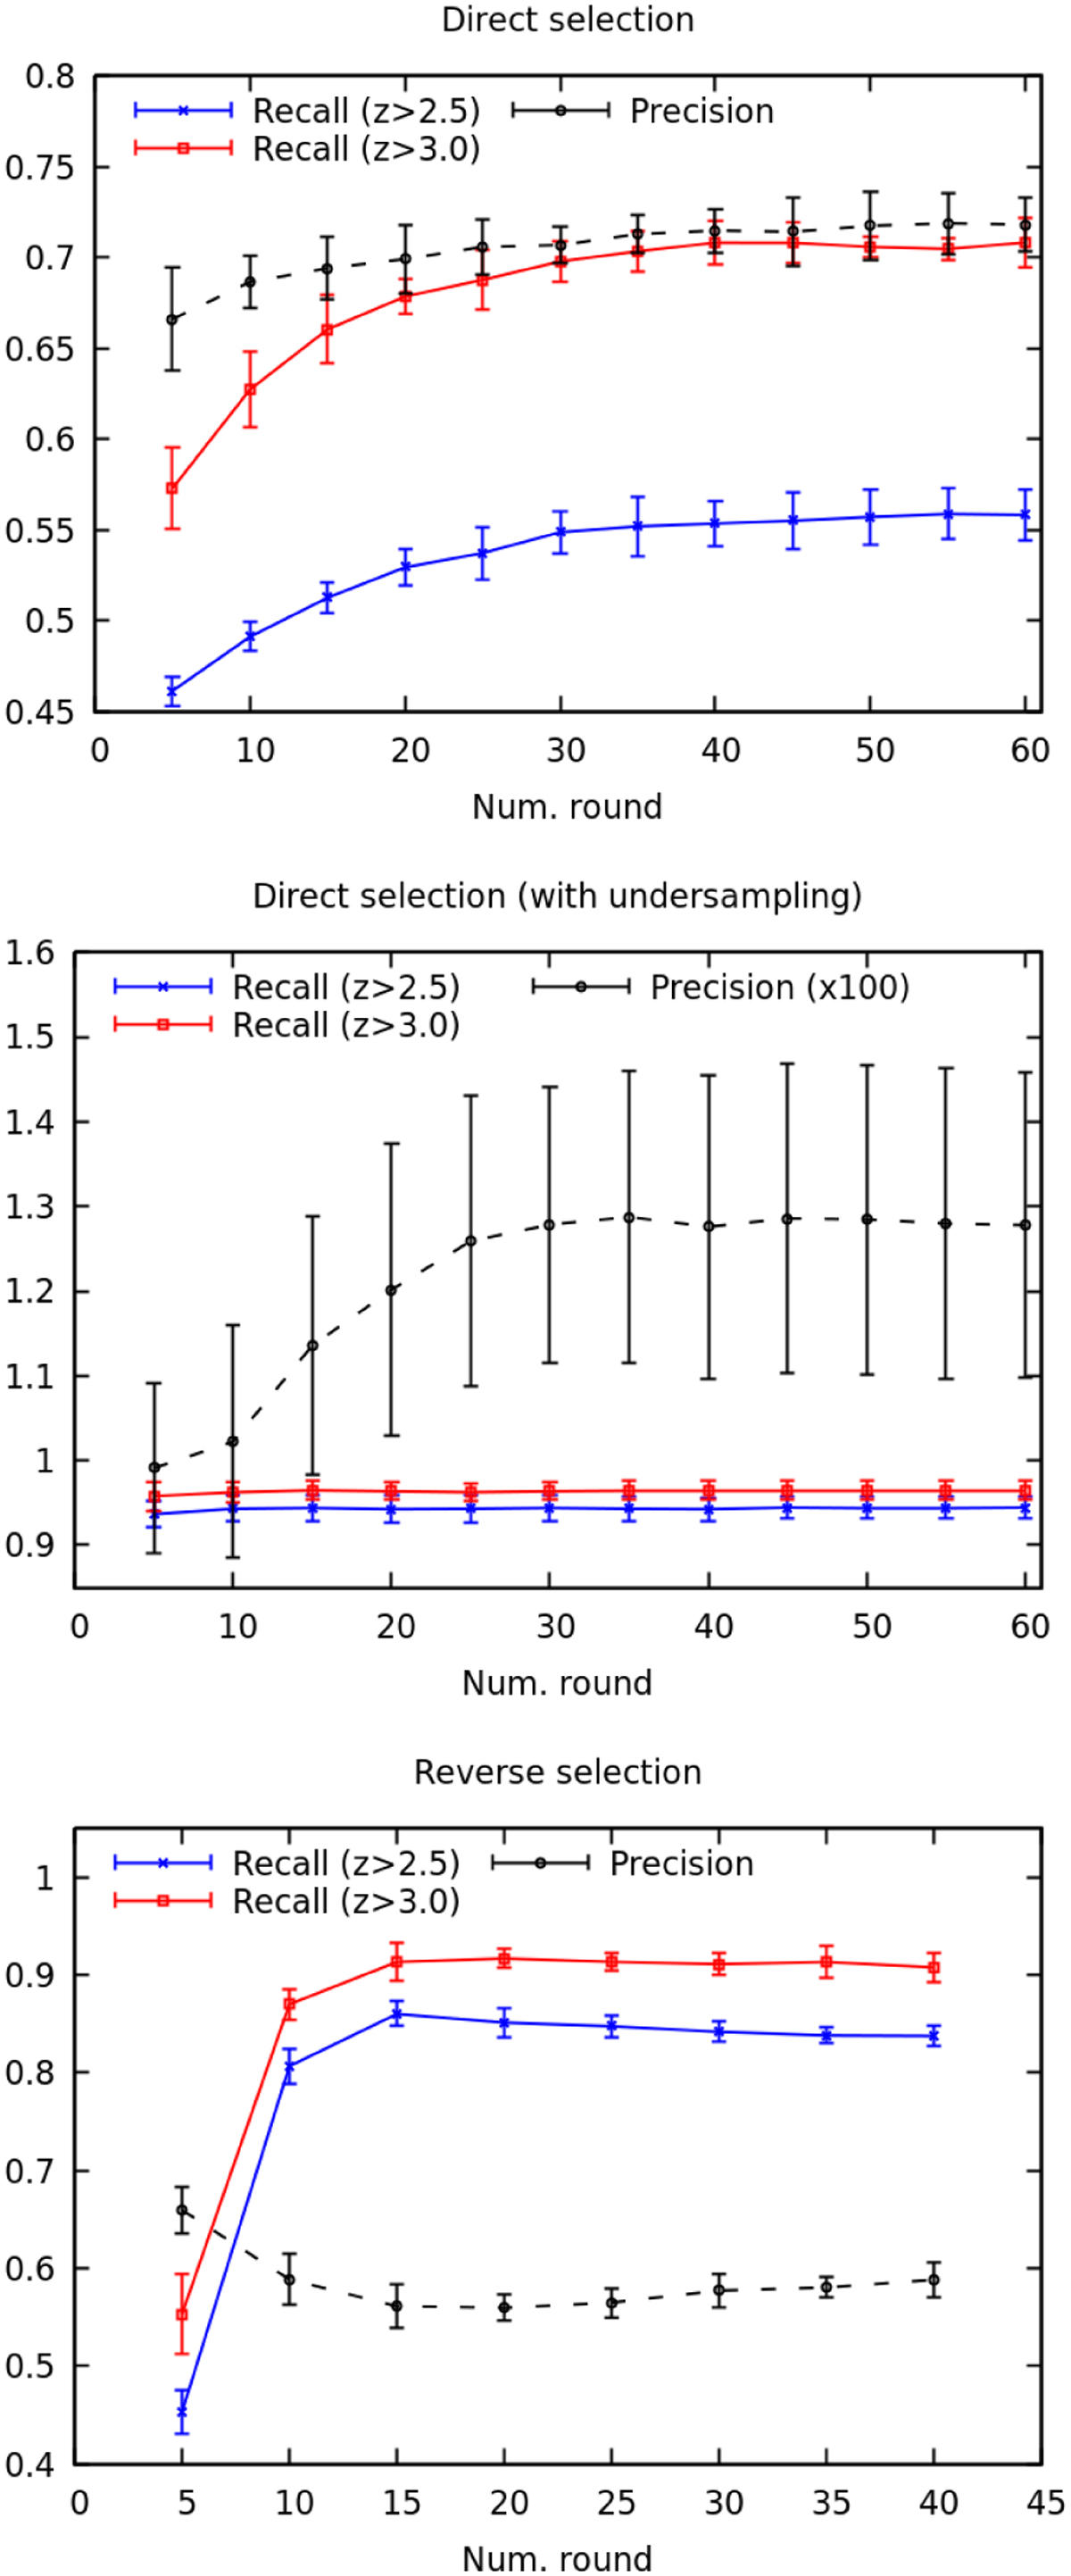
Fig. 3
Download original image
Precision (dashed black line), recall at z > 2.5 (blue line), and at z > 3 (red line) as a function of the XGBoost num_round parameter for the direct selection method (upper panel), direct selection with under-sampling (middle panel), and reverse selection (lower panel) methods. The precision curve in the middle panel is multiplied by a factor 100 to provide a clearer view. The point and error bars represent respectively the mean and the standard deviation over five runs with randomly chosen training-test splits.
Current usage metrics show cumulative count of Article Views (full-text article views including HTML views, PDF and ePub downloads, according to the available data) and Abstracts Views on Vision4Press platform.
Data correspond to usage on the plateform after 2015. The current usage metrics is available 48-96 hours after online publication and is updated daily on week days.
Initial download of the metrics may take a while.