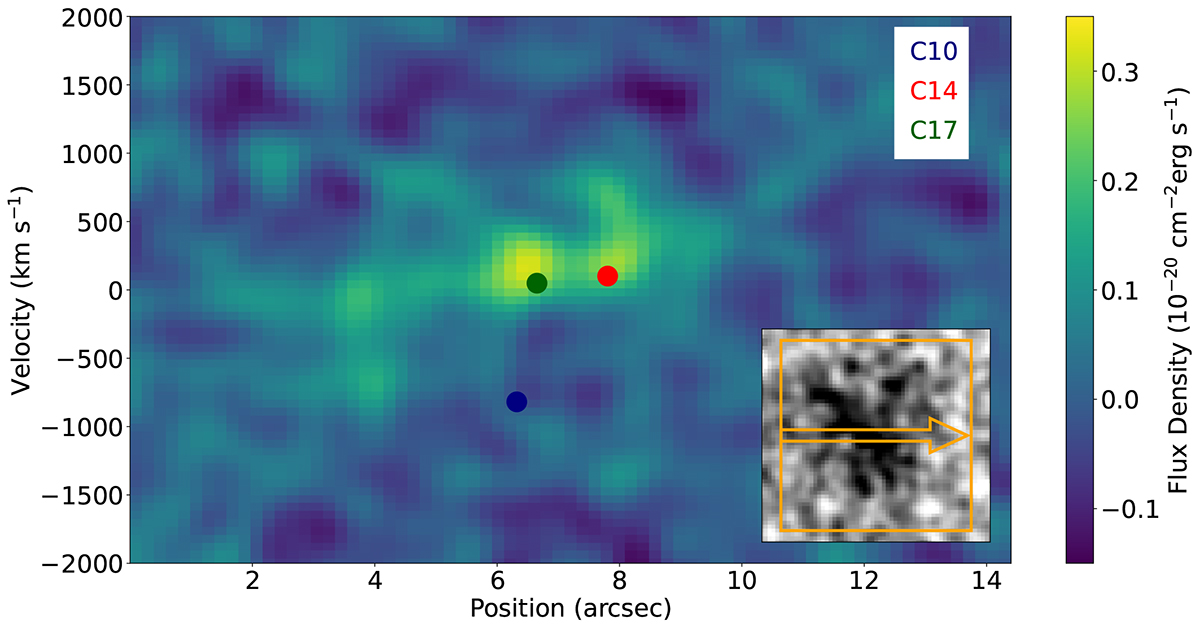
Fig. 6.
Download original image
Position–velocity diagram towards the Lyman-α blob extracted from MUSE cube at 0 degrees of inclination toward the east. Blue, red, and green circles show the observed [C II] emissions (C10, C14, and C17) from Hill et al. (2020). The inset shows the slit used to extract the position–velocity map across LAB using the narrowband image (Sect. 3.2). The Lyman-α velocity is not corrected by Verhamme et al. (2018). This shows a spatial connection between the LAB and two SMG members of the PC.
Current usage metrics show cumulative count of Article Views (full-text article views including HTML views, PDF and ePub downloads, according to the available data) and Abstracts Views on Vision4Press platform.
Data correspond to usage on the plateform after 2015. The current usage metrics is available 48-96 hours after online publication and is updated daily on week days.
Initial download of the metrics may take a while.