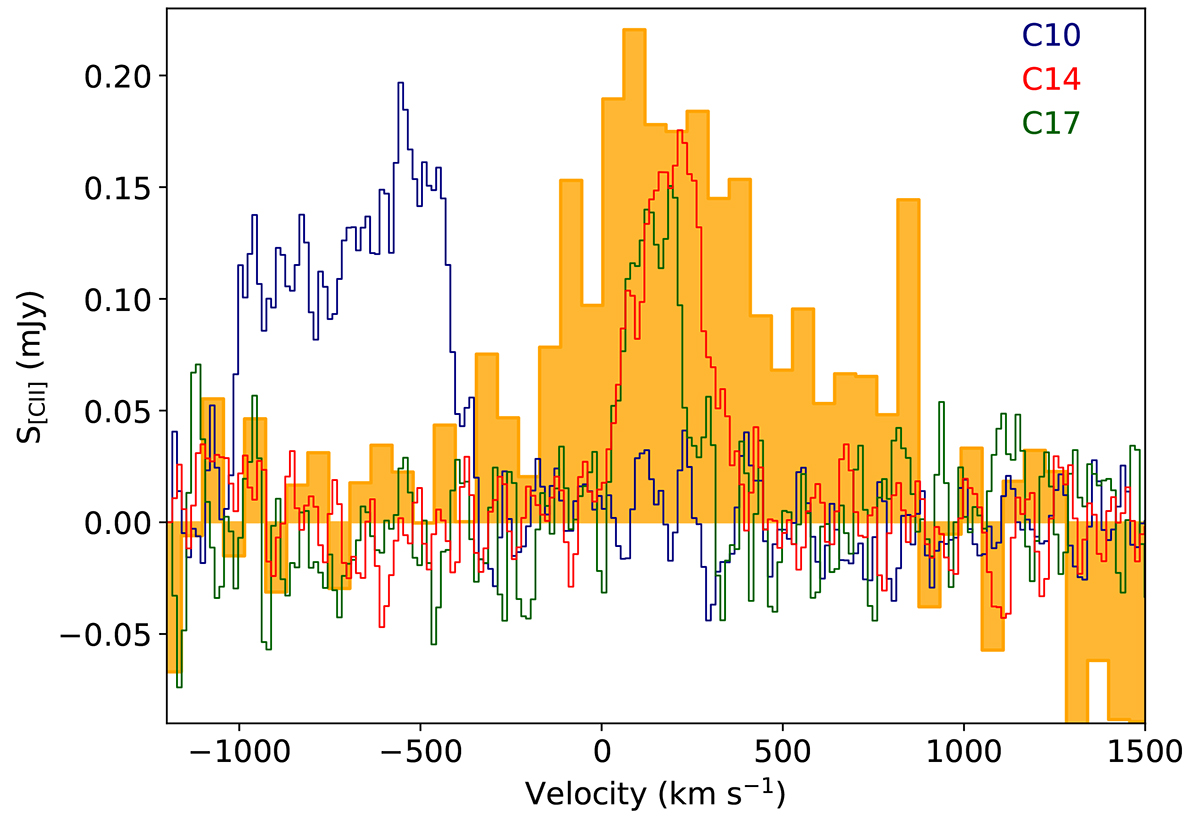
Fig. 5.
Download original image
Observed [C II] line profiles obtained with ALMA for sources C10, C14, and C17 (see, Hill et al. 2020), which overlap spatially with the Lyman-α Blob obtained with MUSE (see Fig. 2). The scaled Lyman-α profile is shown in orange for reference. The velocity scale refers to z = 4.304 for all emission lines. The Lyman-α spectra is not corrected by Verhamme et al. (2018).
Current usage metrics show cumulative count of Article Views (full-text article views including HTML views, PDF and ePub downloads, according to the available data) and Abstracts Views on Vision4Press platform.
Data correspond to usage on the plateform after 2015. The current usage metrics is available 48-96 hours after online publication and is updated daily on week days.
Initial download of the metrics may take a while.