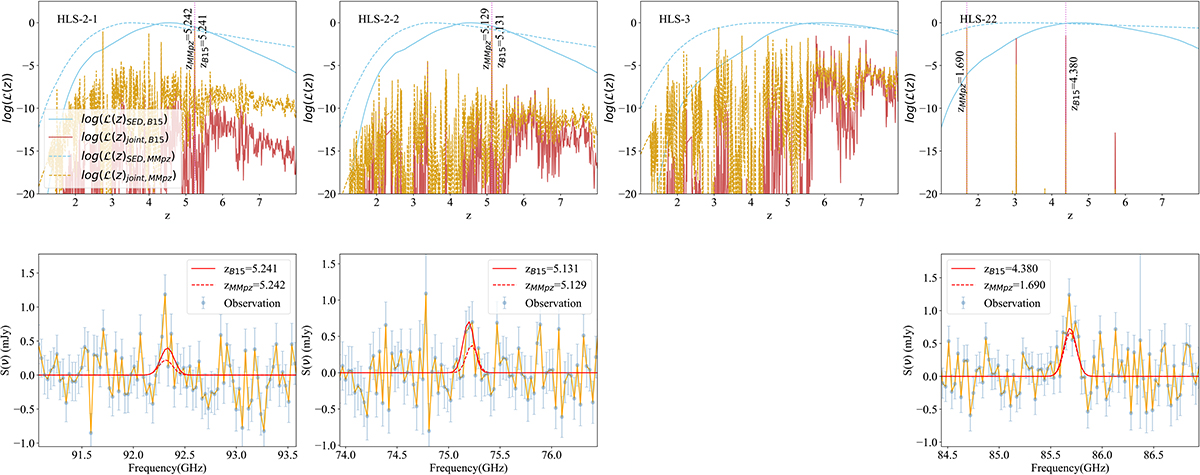
Fig. B.1.
Download original image
Result of the joint analysis of the four HLS sources with spectroscopic redshifts derived in Sect. 4.2, using only the 31 GHz NOEMA spectral scans observed in 2018. The first row shows the likelihood from the SED fittings and the joint log-likelihood of photometric and spectroscopic data, using the SED-fitting outputs with the Béthermin et al. (2015a) templates and MMPZ. The comparison of the observed spectra and the model spectra predicted by the IR luminosities from the two SED-fitting results are shown in the second and third row.
Current usage metrics show cumulative count of Article Views (full-text article views including HTML views, PDF and ePub downloads, according to the available data) and Abstracts Views on Vision4Press platform.
Data correspond to usage on the plateform after 2015. The current usage metrics is available 48-96 hours after online publication and is updated daily on week days.
Initial download of the metrics may take a while.