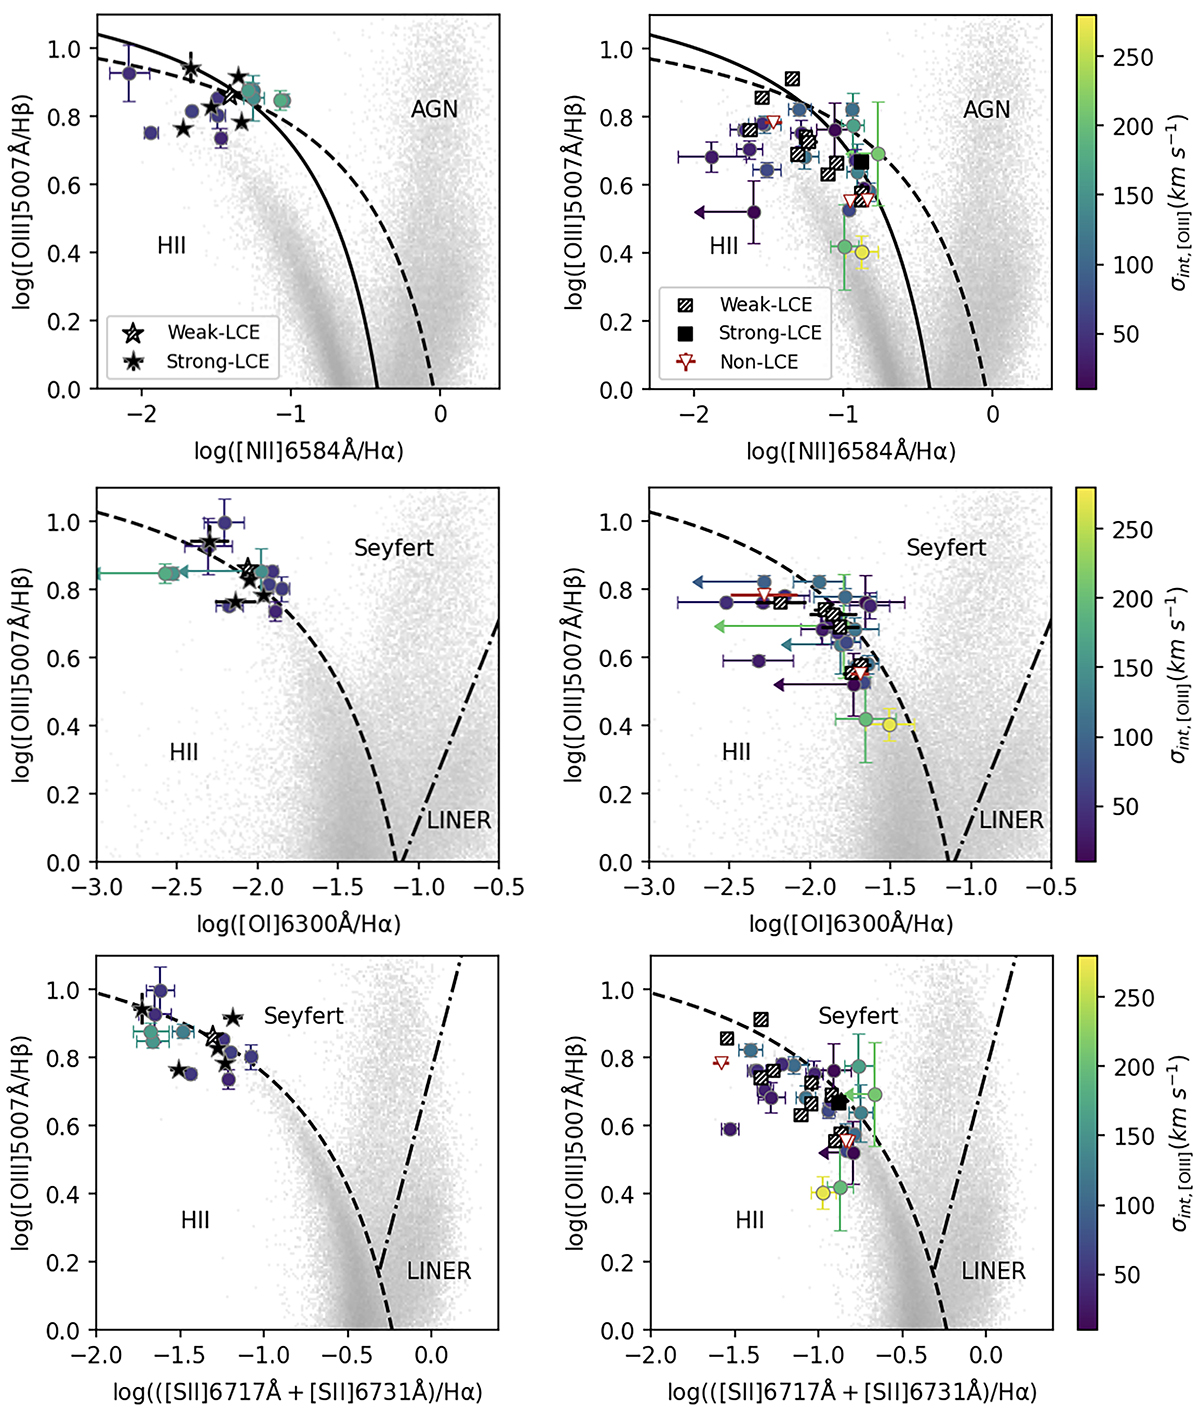
Fig. A.4.
Download original image
Classic diagnostic diagrams. Shown are gas excitation [O III]/Hβ vs. log([N II]/Hα) (top), vs. log([O I]/Hα) (middle), and vs. log([S II]/Hα) (bottom). The left and right panels show the (Izotov et al. 2016a,b, 2018a) and LzLCS (Wang et al. 2021; Flury et al. 2022a) samples (Section 2), respectively. Stars, squares, and open triangles represent integrated values. Circles indicate individual Gaussian components; the color bar gives their intrinsic velocity dispersion.
Current usage metrics show cumulative count of Article Views (full-text article views including HTML views, PDF and ePub downloads, according to the available data) and Abstracts Views on Vision4Press platform.
Data correspond to usage on the plateform after 2015. The current usage metrics is available 48-96 hours after online publication and is updated daily on week days.
Initial download of the metrics may take a while.