Fig. A.2.
Download original image
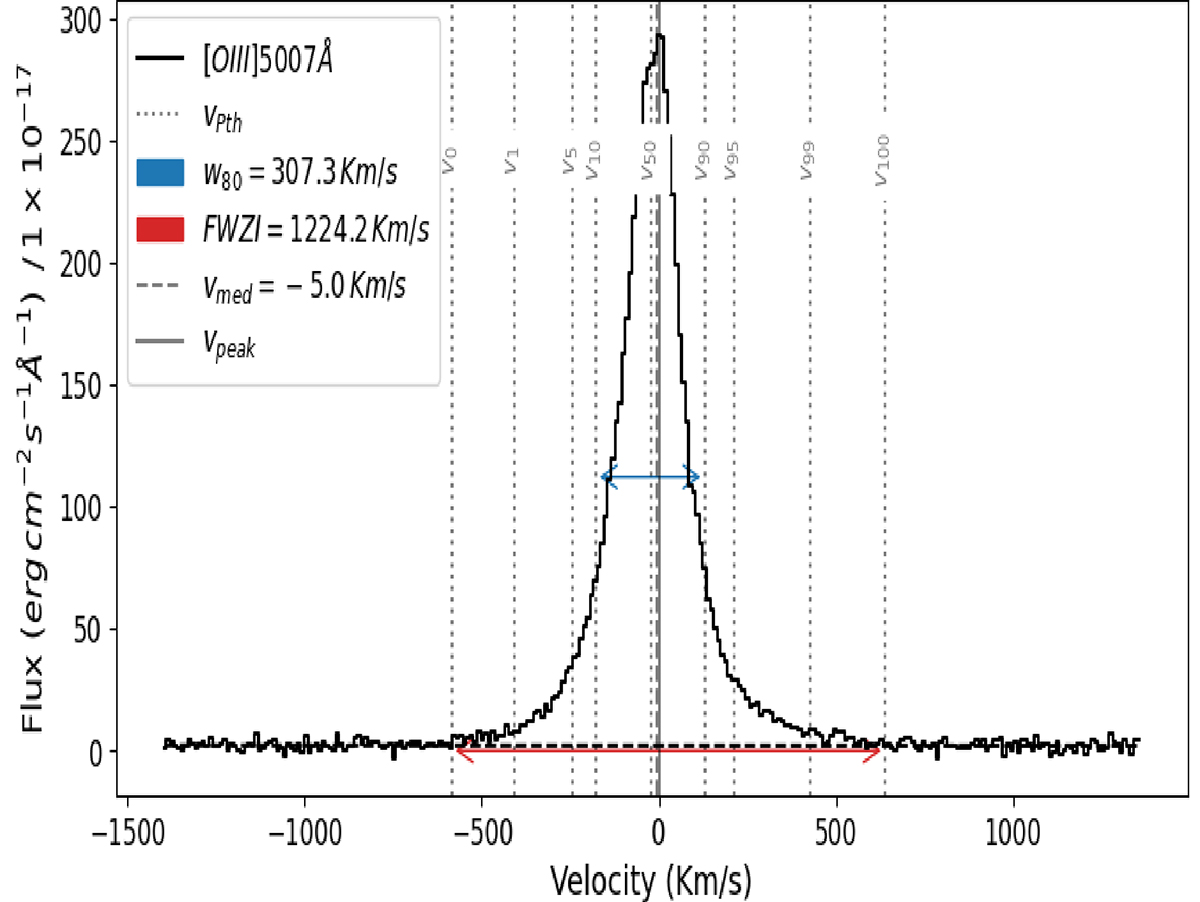
Illustration of the inter-percentile analysis performed by LiMe (Fernández et al. 2023, fully documented in https://lime-stable.readthedocs.io/en/latest/). Shown are the [O III] 5007 line profile of the LCE J115204+340049. The velocity percentiles vp enclosing p% of the total line integrated flux are indicated with vertical dotted lines. The red arrow line illustrates the full width at zero intensity (FWZI) computed as v100 − v0. The inset also shows values for the derived relevant quantities, including w80 (blue arrow) and the median (vmed) and peak velocity (vpeak), the latter assumed to be the systemic velocity (see Section 2).
Current usage metrics show cumulative count of Article Views (full-text article views including HTML views, PDF and ePub downloads, according to the available data) and Abstracts Views on Vision4Press platform.
Data correspond to usage on the plateform after 2015. The current usage metrics is available 48-96 hours after online publication and is updated daily on week days.
Initial download of the metrics may take a while.