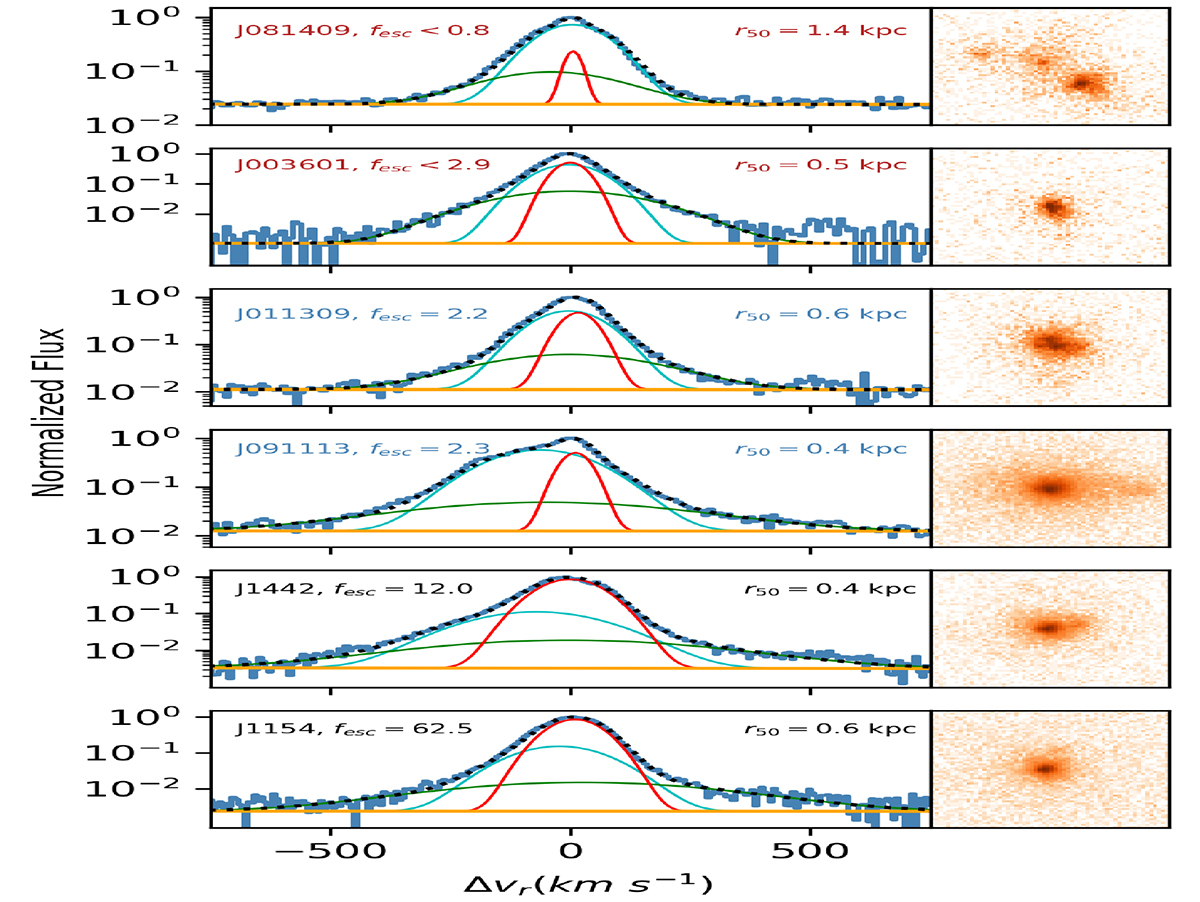
Fig. 2.
Download original image
Three-Gaussian model of [O III]5007 for a subsample observed with X-shooter. Galaxies are shown in order of increasing LyC fesc percentage. The two upper panels show galaxies classified as NLCE, the two middle panels show SLCEs, and the two bottom panels show SLCEs. The right panels show HST-COS NUV acquisition images of 1.4″ per side for each galaxy. The spectra are normalized to the peak flux and are shown in log scale to highlight low-surface-brightness wings.
Current usage metrics show cumulative count of Article Views (full-text article views including HTML views, PDF and ePub downloads, according to the available data) and Abstracts Views on Vision4Press platform.
Data correspond to usage on the plateform after 2015. The current usage metrics is available 48-96 hours after online publication and is updated daily on week days.
Initial download of the metrics may take a while.