Fig. 1.
Download original image
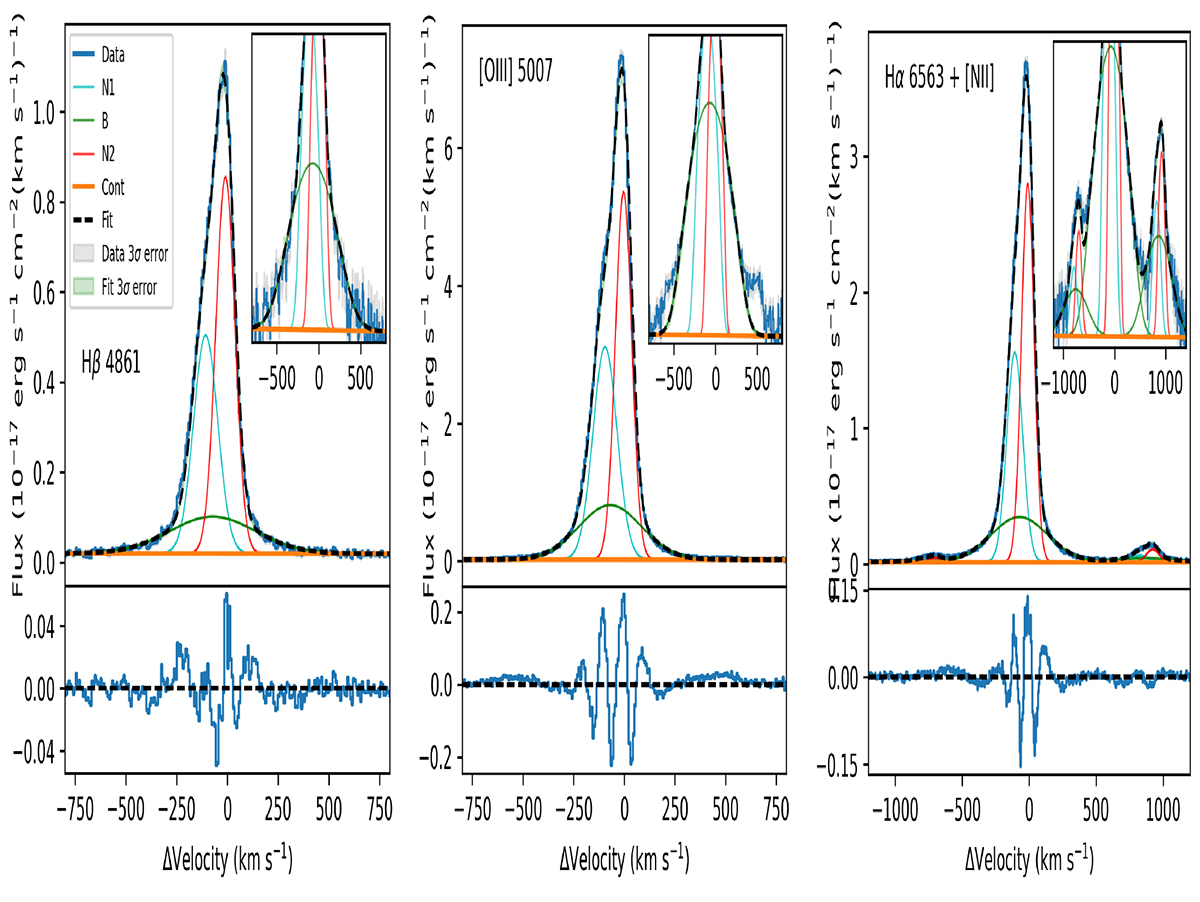
Gaussian models (black dashed line) fitted to the observed Hβ (left), [O III] λ 5007 (center), and Hα+[NII] 6748,6584 (right) lines in the WHT/ISIS spectra of the SLCE J0925+1403. The bottom panels show residuals in the same flux units. The continuum (orange line) and the two narrow (N1, N2) and broad (B) components are shown in cyan, red, and green, respectively. The inset shows a zoomed-in image of the line wings.
Current usage metrics show cumulative count of Article Views (full-text article views including HTML views, PDF and ePub downloads, according to the available data) and Abstracts Views on Vision4Press platform.
Data correspond to usage on the plateform after 2015. The current usage metrics is available 48-96 hours after online publication and is updated daily on week days.
Initial download of the metrics may take a while.