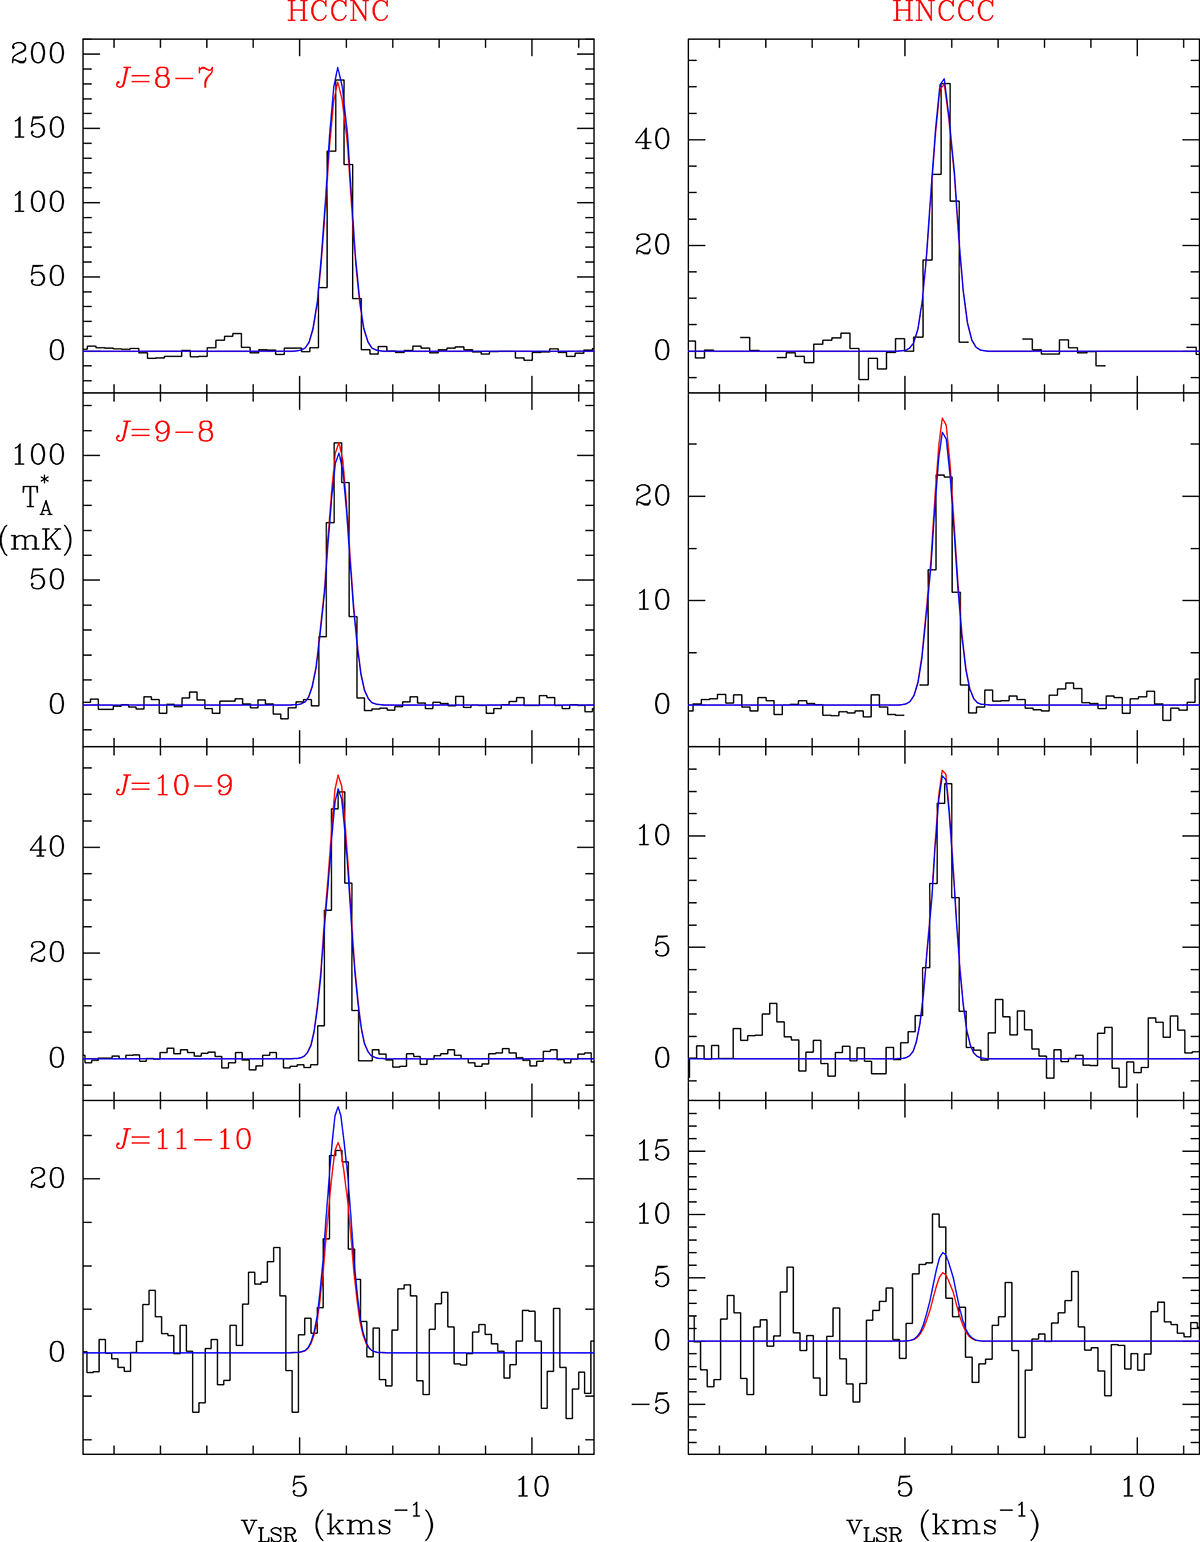
Fig. A.1.
Download original image
Observed lines in the 3mm domain of HCCNC (left panels) and HNCCC (right panels). The abscissa and ordinate are those of Fig. 1. The computed synthetic spectra adopting a constant rotational temperature are shown in red, whereas those obtained from the LVG model are shown in blue (see Sect. 3.3). The derived line parameters are given in Table A.1.
Current usage metrics show cumulative count of Article Views (full-text article views including HTML views, PDF and ePub downloads, according to the available data) and Abstracts Views on Vision4Press platform.
Data correspond to usage on the plateform after 2015. The current usage metrics is available 48-96 hours after online publication and is updated daily on week days.
Initial download of the metrics may take a while.