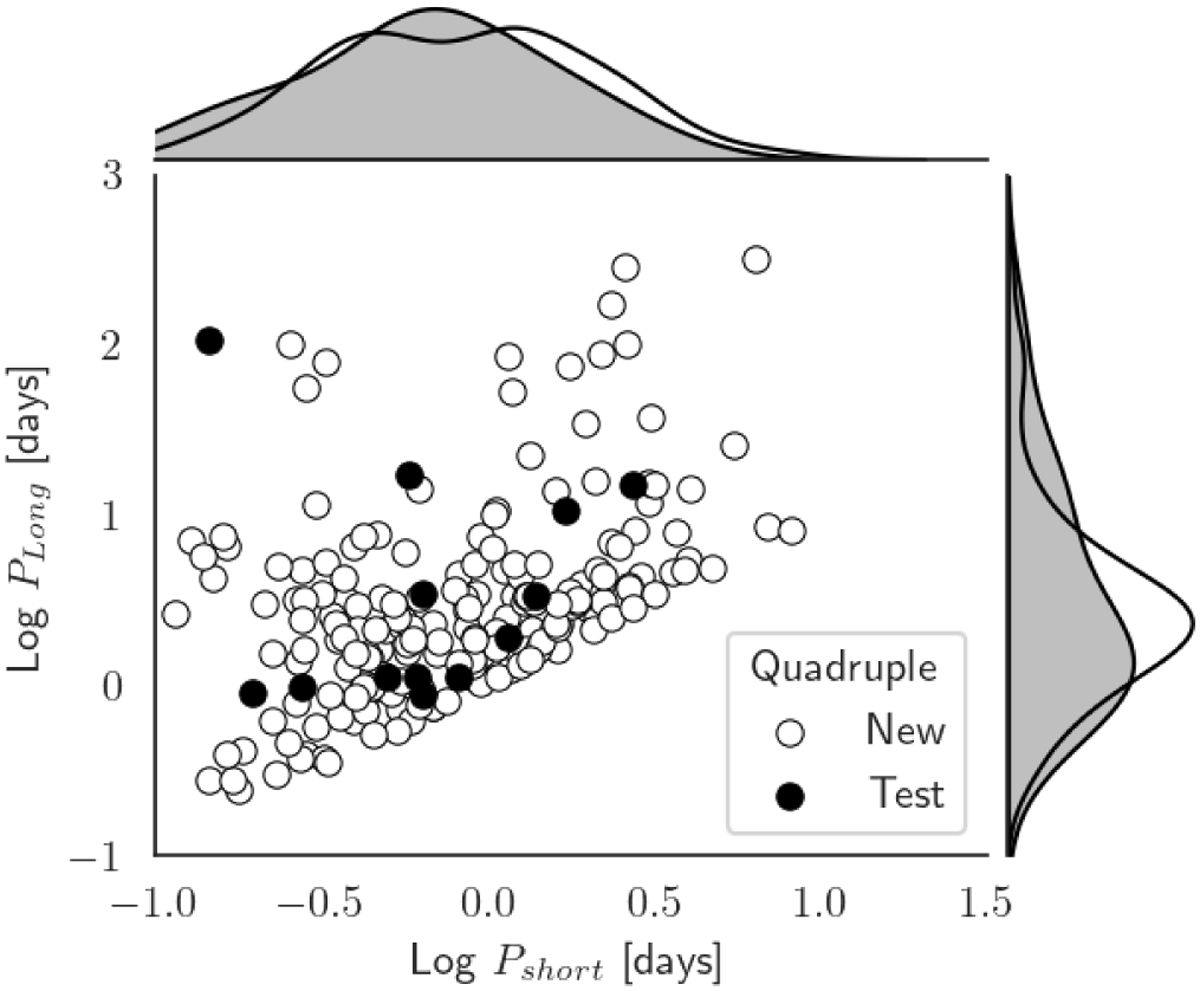
Fig. 2
Download original image
Periods A and B of 13 test objects and 203 quadruple candidates. Here Pshort is defined as the shortest period of A and B, and Plong as the longest period of A and B. The figure shows that most objects have both periods shorter than a few days. Using a kernel density estimate, this distribution seems to be the same for the candidates and test objects.
Current usage metrics show cumulative count of Article Views (full-text article views including HTML views, PDF and ePub downloads, according to the available data) and Abstracts Views on Vision4Press platform.
Data correspond to usage on the plateform after 2015. The current usage metrics is available 48-96 hours after online publication and is updated daily on week days.
Initial download of the metrics may take a while.