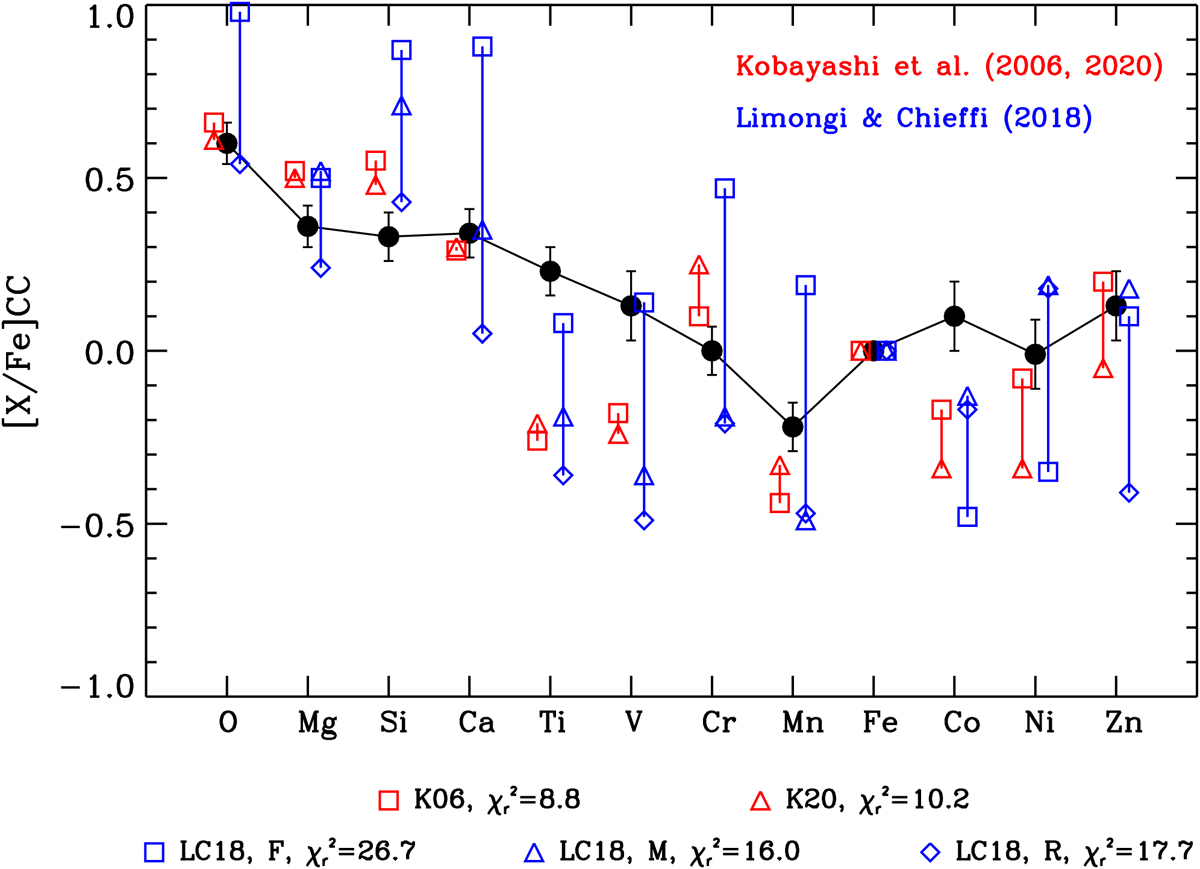
Fig. 6.
Download original image
Comparison of empirical [X/Fe]CC yields with IMF integrated yields predicted from models of CC SNe. The empirical yields are shown with filled black circles. Yields predicted from the models of Kobayashi et al. (2006; 2020, K06 and K20) are plotted with red symbols and yields calculated from Limongi & Chieffi (2018, LC18, models F, M, and R) with blue symbols; see text for details. For each model, the reduced chi-square for the comparison with the empirical yields is given.
Current usage metrics show cumulative count of Article Views (full-text article views including HTML views, PDF and ePub downloads, according to the available data) and Abstracts Views on Vision4Press platform.
Data correspond to usage on the plateform after 2015. The current usage metrics is available 48-96 hours after online publication and is updated daily on week days.
Initial download of the metrics may take a while.