Open Access
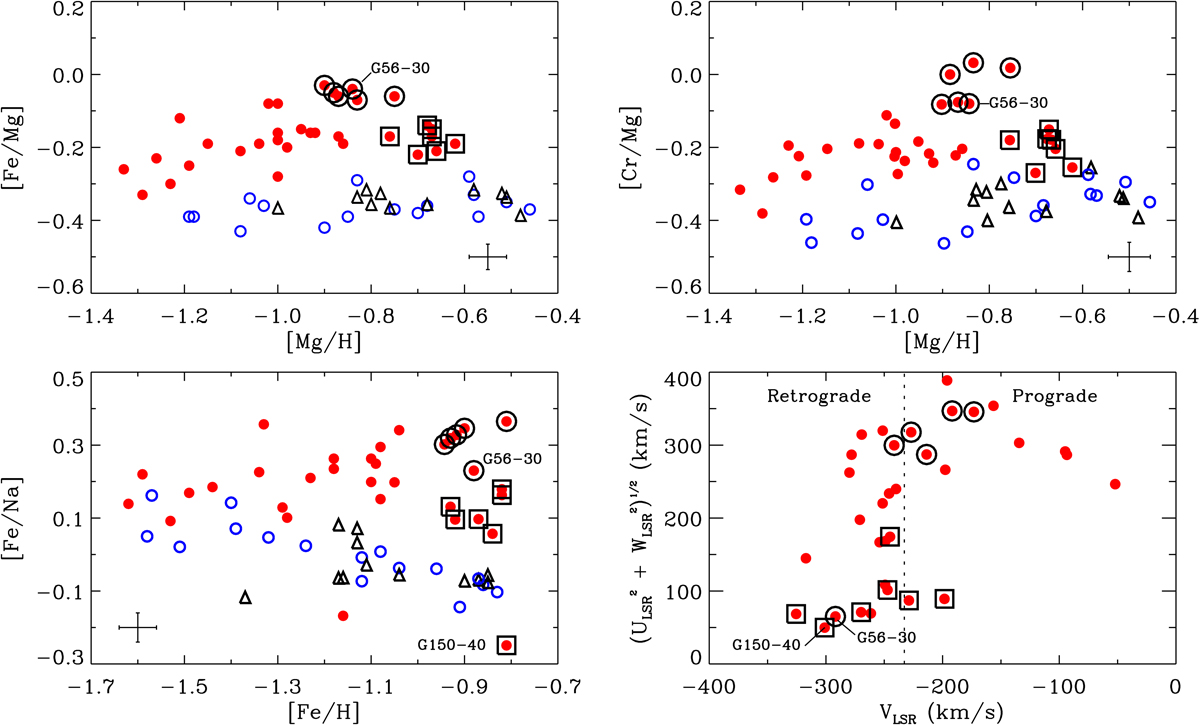
Fig. 5.
Download original image
Substructure in the distribution of [Fe/Mg], [Cr/Mg], and [Fe/Na] for low-α stars with [Mg/H] ≃ −0.8. Stars with high [Fe/Mg] values are labelled with black circles and those with lower [Fe/Mg] values with squares. In the lower right panel, the Toomre diagram for the low-α stars is shown with the same labelling.
Current usage metrics show cumulative count of Article Views (full-text article views including HTML views, PDF and ePub downloads, according to the available data) and Abstracts Views on Vision4Press platform.
Data correspond to usage on the plateform after 2015. The current usage metrics is available 48-96 hours after online publication and is updated daily on week days.
Initial download of the metrics may take a while.