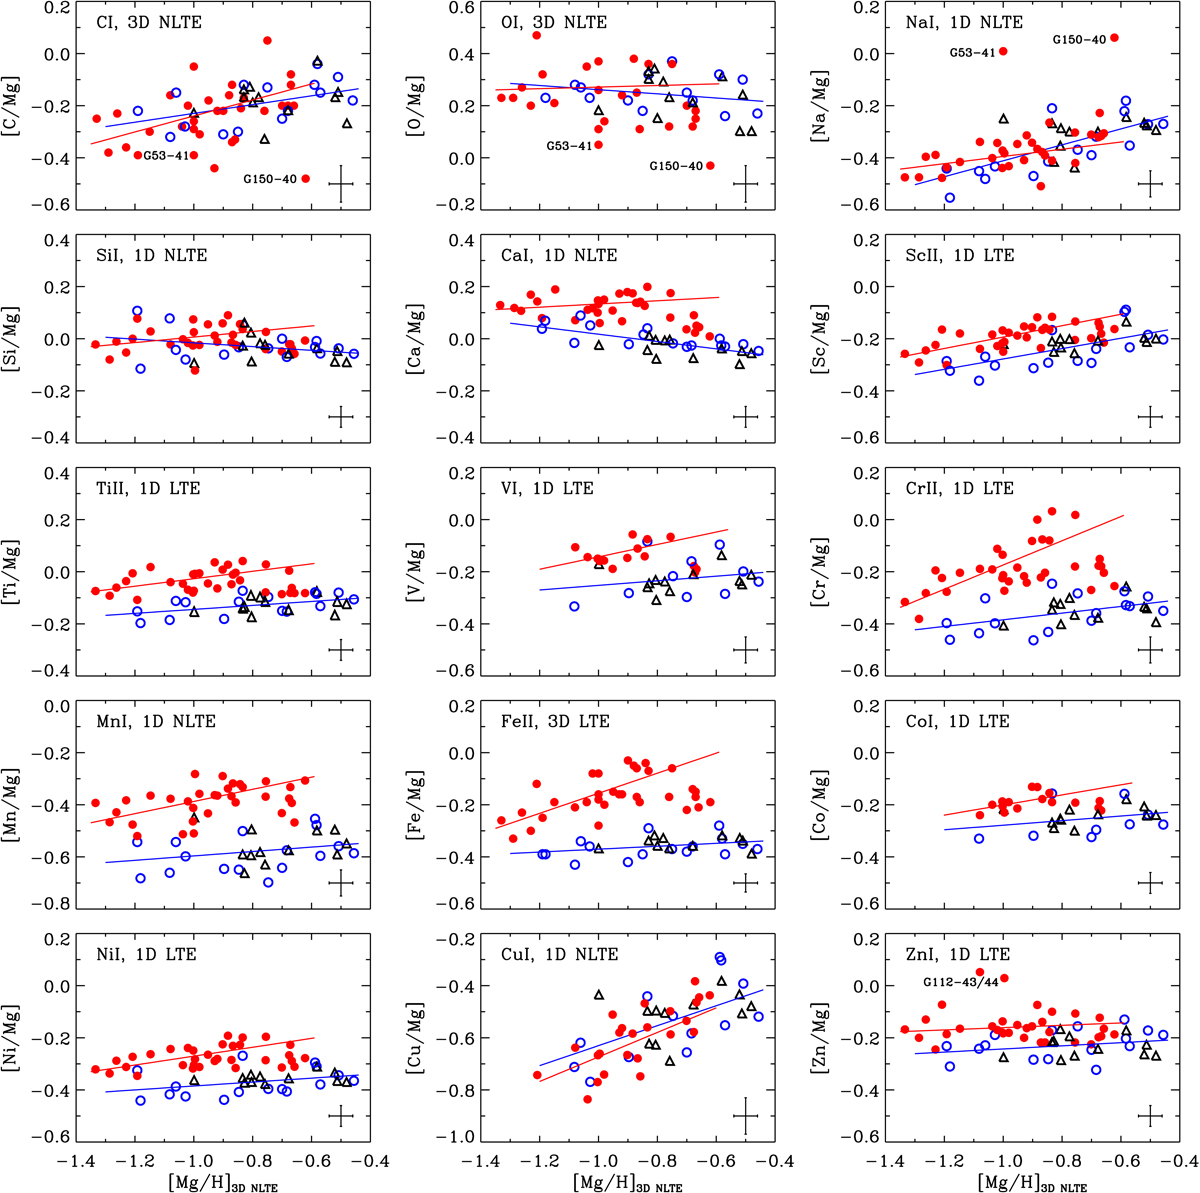
Fig. 4.
Download original image
[X/Mg] as a function of [Mg/H] with the same symbols as in Fig. 2. The blue lines show least-squares fits to the high-α stars and the red lines show fits to the low-α stars after excluding stars probably associated with the Thamnos substructure (see Fig. 5). On each panel, the atomic species of spectral lines used for deriving abundances and the method of analysis are indicated.
Current usage metrics show cumulative count of Article Views (full-text article views including HTML views, PDF and ePub downloads, according to the available data) and Abstracts Views on Vision4Press platform.
Data correspond to usage on the plateform after 2015. The current usage metrics is available 48-96 hours after online publication and is updated daily on week days.
Initial download of the metrics may take a while.