Open Access
Fig. 3.
Download original image
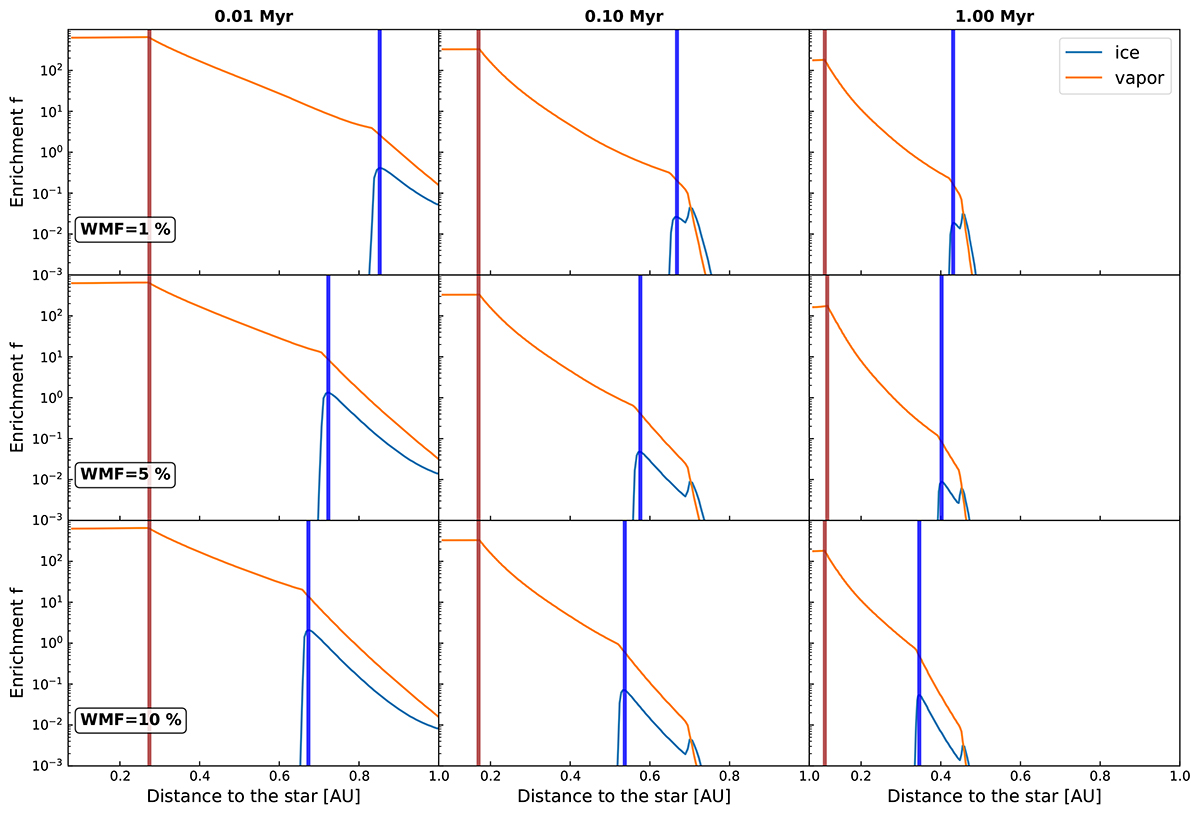
From left to right: Enrichment profiles of water vapor (orange lines) and ice (blue lines) normalized with the initial abundance of water in phyllosilicates at t = 0.01, 0.1, and 1 Myr. The initial WMFs in phyllosilicates here are 1%, 5%, and 10%. The PDL and SL are represented as brown and blue bars, respectively.
Current usage metrics show cumulative count of Article Views (full-text article views including HTML views, PDF and ePub downloads, according to the available data) and Abstracts Views on Vision4Press platform.
Data correspond to usage on the plateform after 2015. The current usage metrics is available 48-96 hours after online publication and is updated daily on week days.
Initial download of the metrics may take a while.