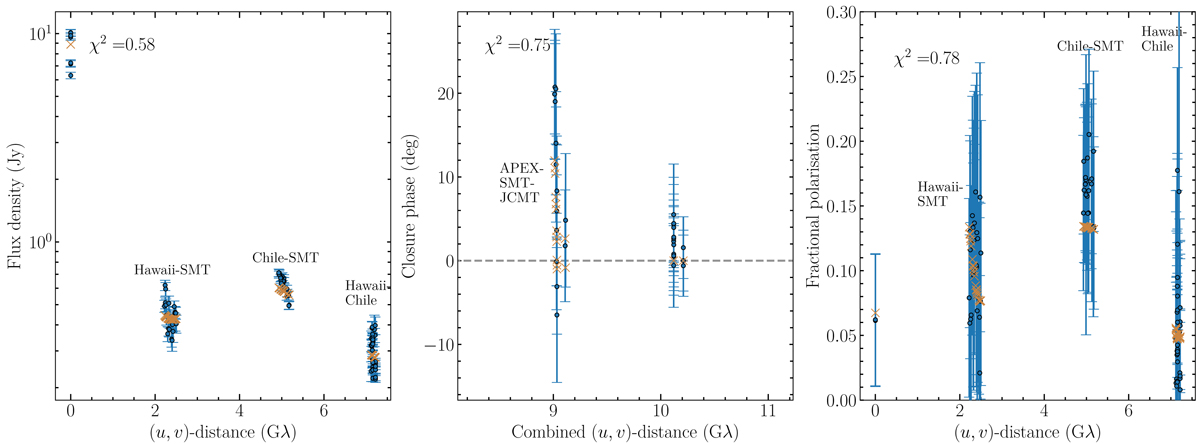
Fig. A.1.
Download original image
Best-fit model of 3C 84 compared to the data. Presented here from left to right are the data points (denoted with round blue markers) and models (denoted with dark orange crosses) of the visibility amplitudes, closure phases, and fractional polarisation as a function of the (u, v) distance. The combined (u, v) distance used in the middle panel is defined as the square root of the sum of squared lengths of all three baselines forming a triangle. Error bars in all panels indicate the 68% confidence level.
Current usage metrics show cumulative count of Article Views (full-text article views including HTML views, PDF and ePub downloads, according to the available data) and Abstracts Views on Vision4Press platform.
Data correspond to usage on the plateform after 2015. The current usage metrics is available 48-96 hours after online publication and is updated daily on week days.
Initial download of the metrics may take a while.