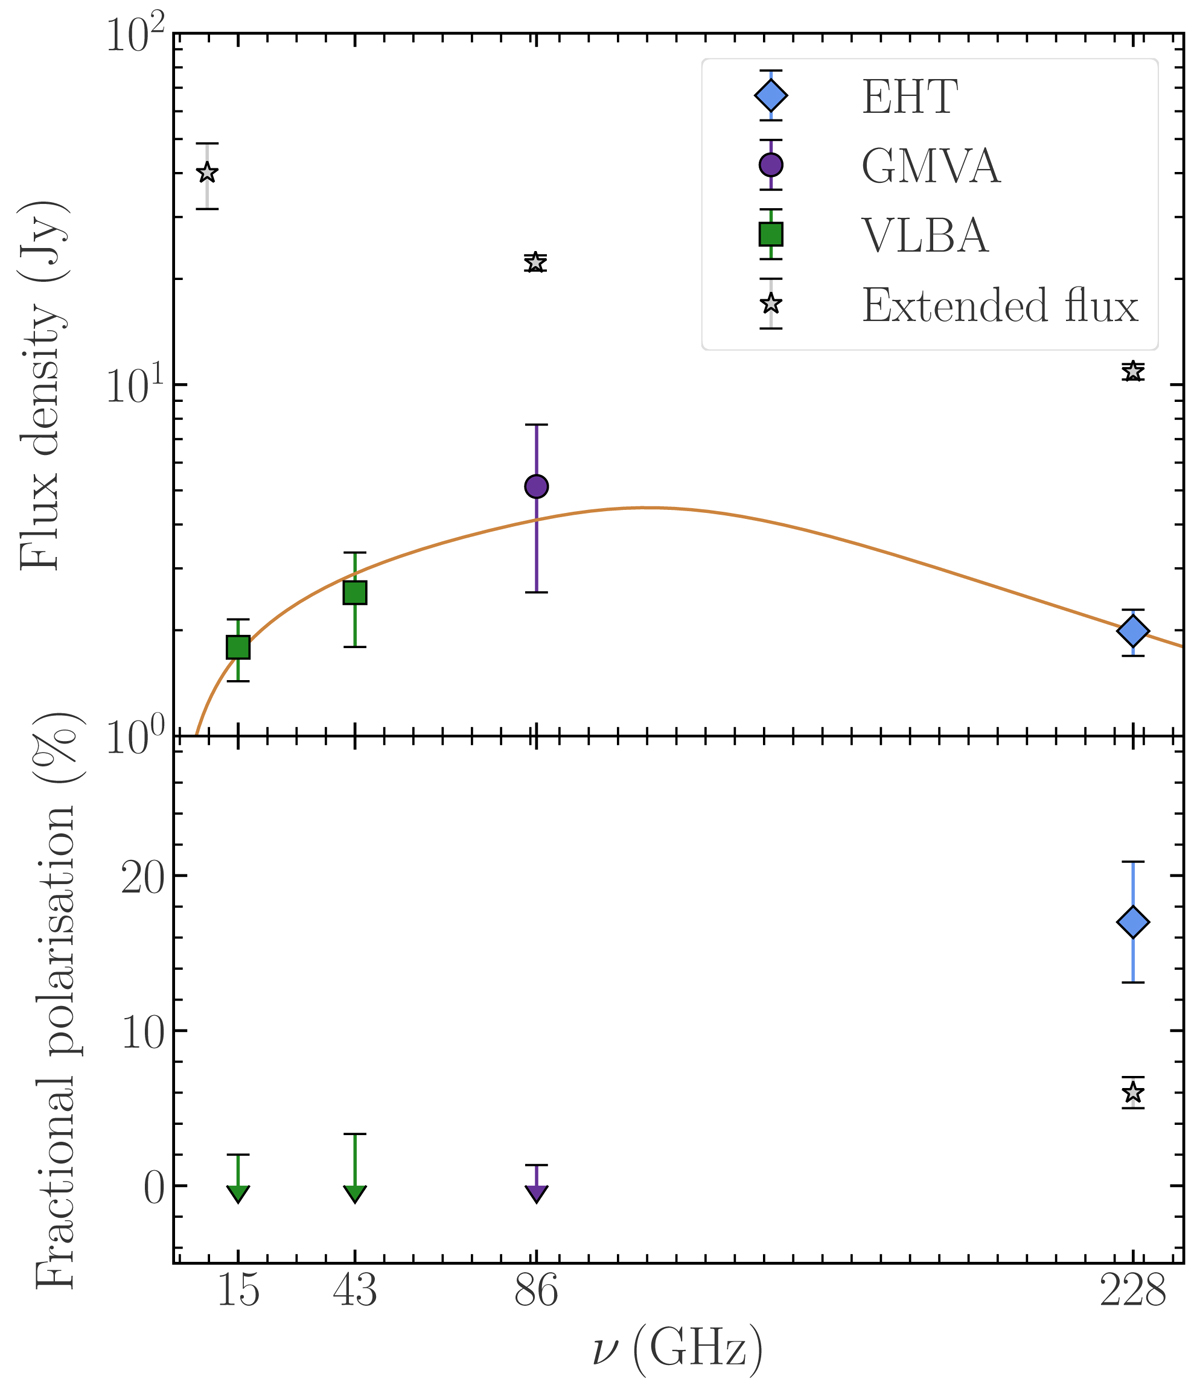
Fig. 3.
Download original image
VLBI and single-dish total intensity and fractional polarisation versus frequency for 3C 84, observed in March and April 2017. Top: green box markers, purple dot, and light blue diamond denote the total intensity, compact-scale VLBI flux density measurements at 15, 43, 86, and 228 GHz, respectively. The latter data point is the sum of components E, C, and W (see Table A.1). The orange line denotes the fit to the spectrum using Eq. (D.1). The grey star markers denote the single-dish (extended) flux density measurements at 8 (QUIVER), 86, and 228 GHz (POLAMI). The turnover frequency is between 86 and 228 GHz. The 8 GHz single-dish flux density is higher than at 86 GHz, because the parsec-scale jet flux density contributes to the measurement. Bottom: green and purple arrows indicate the upper limits of the fractional polarisation at 15, 43, and 86 GHz measured in the same region as the total intensity values in the upper panel. The light blue diamond marker again indicates the EHT measurement at 228 GHz. The grey star marker indicates the zero-baseline fractional polarisation on the baseline between ALMA and APEX. Error bars in both panels indicate the 68% confidence level.
Current usage metrics show cumulative count of Article Views (full-text article views including HTML views, PDF and ePub downloads, according to the available data) and Abstracts Views on Vision4Press platform.
Data correspond to usage on the plateform after 2015. The current usage metrics is available 48-96 hours after online publication and is updated daily on week days.
Initial download of the metrics may take a while.