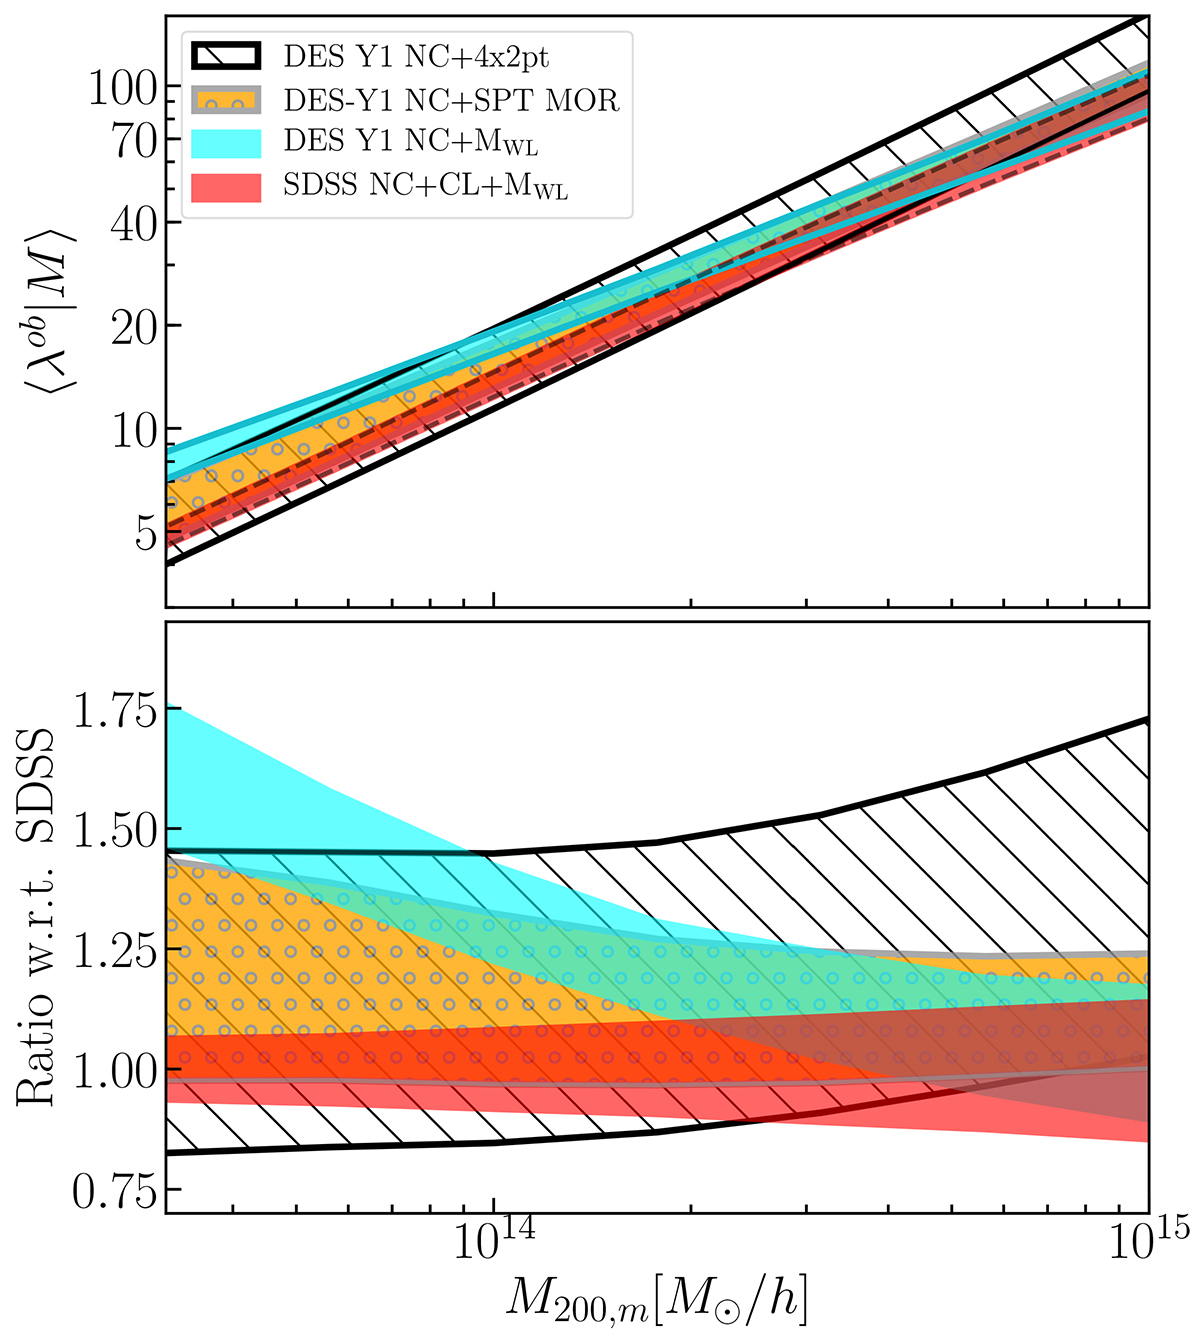
Fig. 6.
Download original image
Comparison of the mean richness-mass relations derived in this work (red band) and those derived from different analyses of the DES-Y1 redMaPPer cluster sample: DES-Y1 number counts and weak-lensing mass estimates (Dark Energy Survey Collaboration 2020, cyan band), DES-Y1 cluster count data and SPT-SZ follow-up data (Costanzi 2021, orange-dotted band), and DES-Y1 cluster abundance with galaxy, lensing, and cluster auto- and cross-correlation function (To et al. 2021a, black-hatched band). The band width corresponds to a 1σ uncertainty of the mean relation. Lower panel: ratio of the DES-Y1 scaling relations with respect to the SDSS result.
Current usage metrics show cumulative count of Article Views (full-text article views including HTML views, PDF and ePub downloads, according to the available data) and Abstracts Views on Vision4Press platform.
Data correspond to usage on the plateform after 2015. The current usage metrics is available 48-96 hours after online publication and is updated daily on week days.
Initial download of the metrics may take a while.