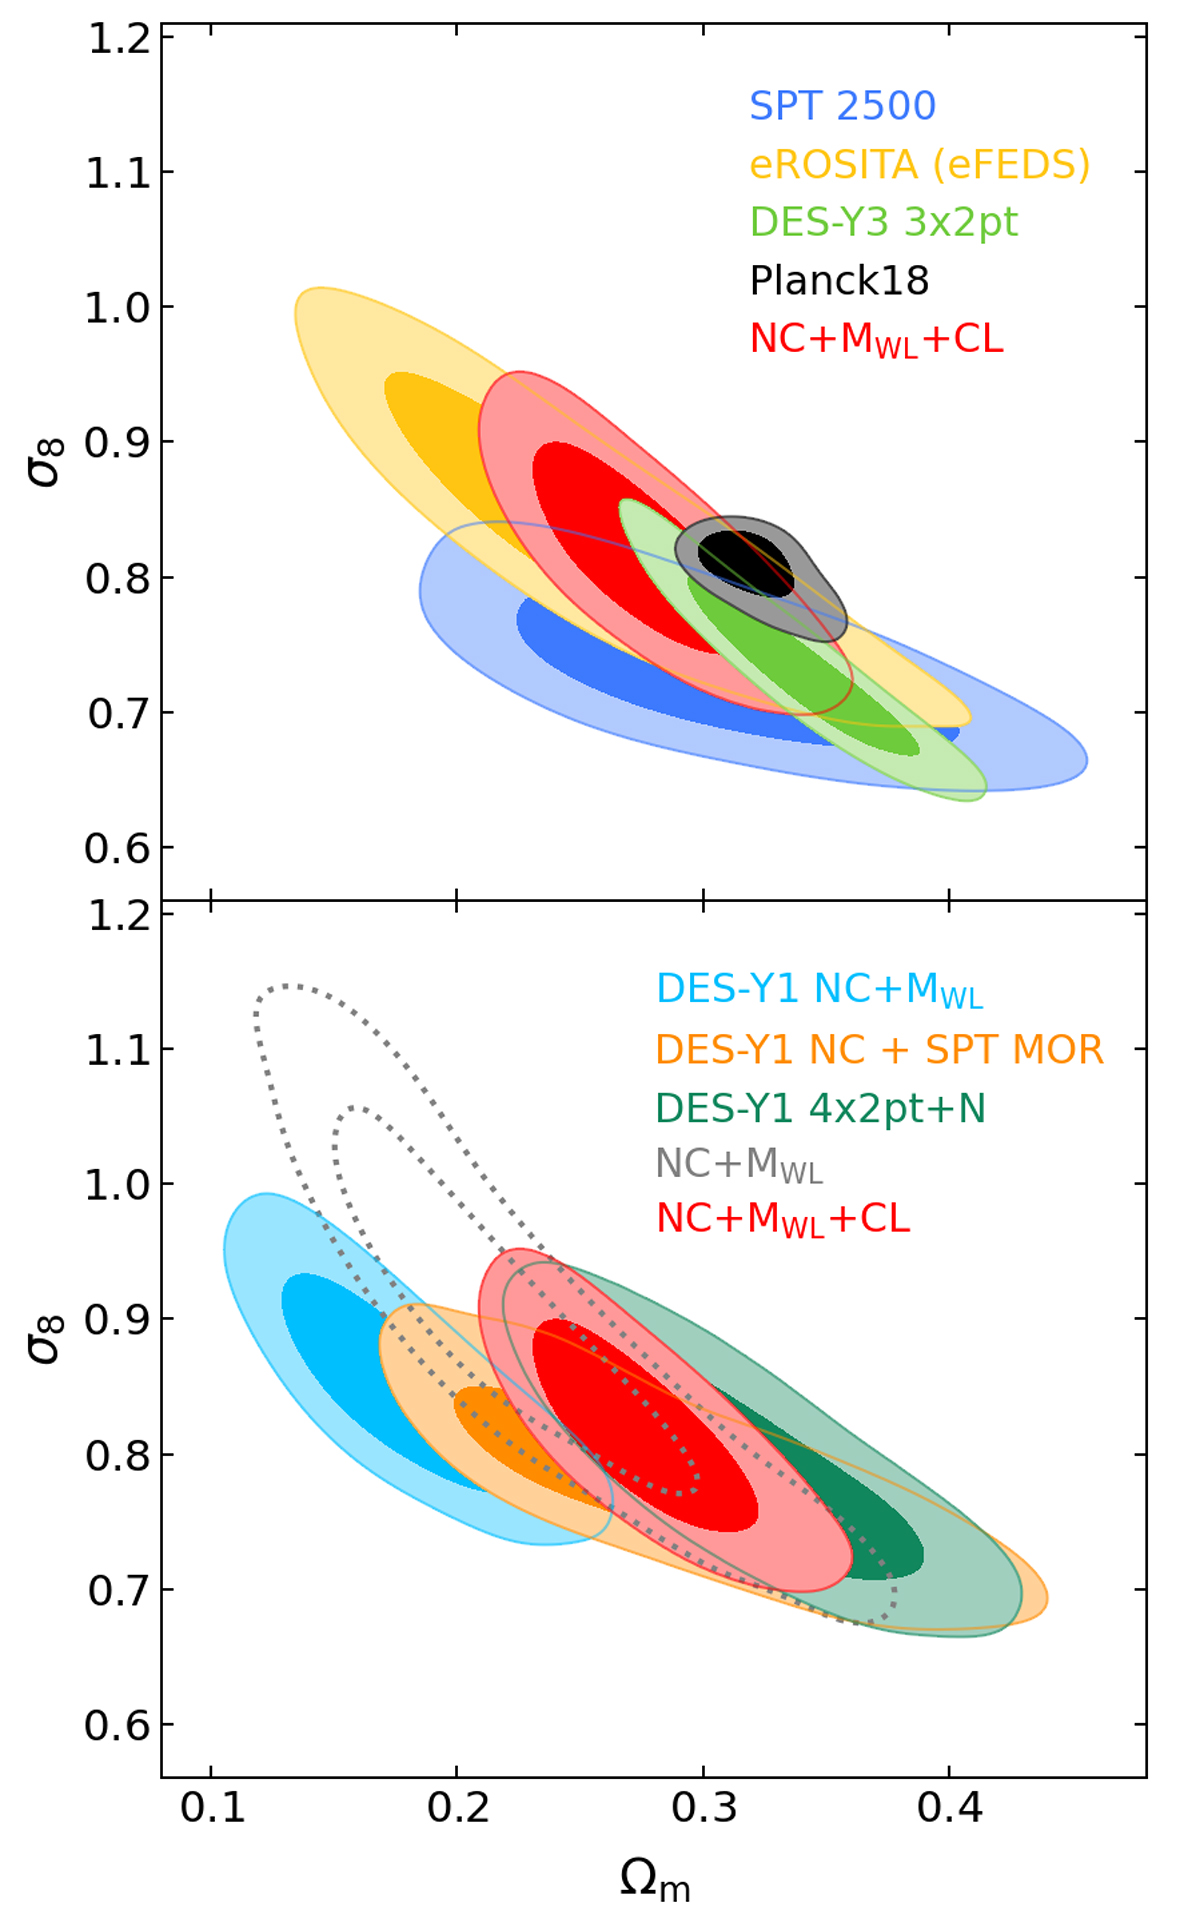
Fig. 5.
Download original image
Comparison of Ωm − σ8 posteriors obtained by different surveys. Top panel: 2500 deg2 SPT-SZ cluster survey (Bocquet et al. 2019, blue contours), eROSITA (eFEDS) cluster survey (Chiu et al. 2023, yellow contours), DES-Y3 NC+3x2pt (Dark Energy Survey Collaboration 2022, green contours), and Planck TT,TE,EE+lowE with free mν (Planck Collaboration VI 2020, black countours), compared to our results in the NC+MWL+CL (red contours) analyses. Bottom panel: DES-Y1 number counts and weak-lensing mass estimates (Dark Energy Survey Collaboration 2020, cyan contours), DES-Y1 cluster count data and SPT-SZ follow-up data (Costanzi 2021, orange contours), and DES-Y1 NC+4x2pt (To et al. 2021a, dark green contours), compared to our results from the NC+MWL (dotted gray contours) and NC+MWL+CL (red contours) results.
Current usage metrics show cumulative count of Article Views (full-text article views including HTML views, PDF and ePub downloads, according to the available data) and Abstracts Views on Vision4Press platform.
Data correspond to usage on the plateform after 2015. The current usage metrics is available 48-96 hours after online publication and is updated daily on week days.
Initial download of the metrics may take a while.