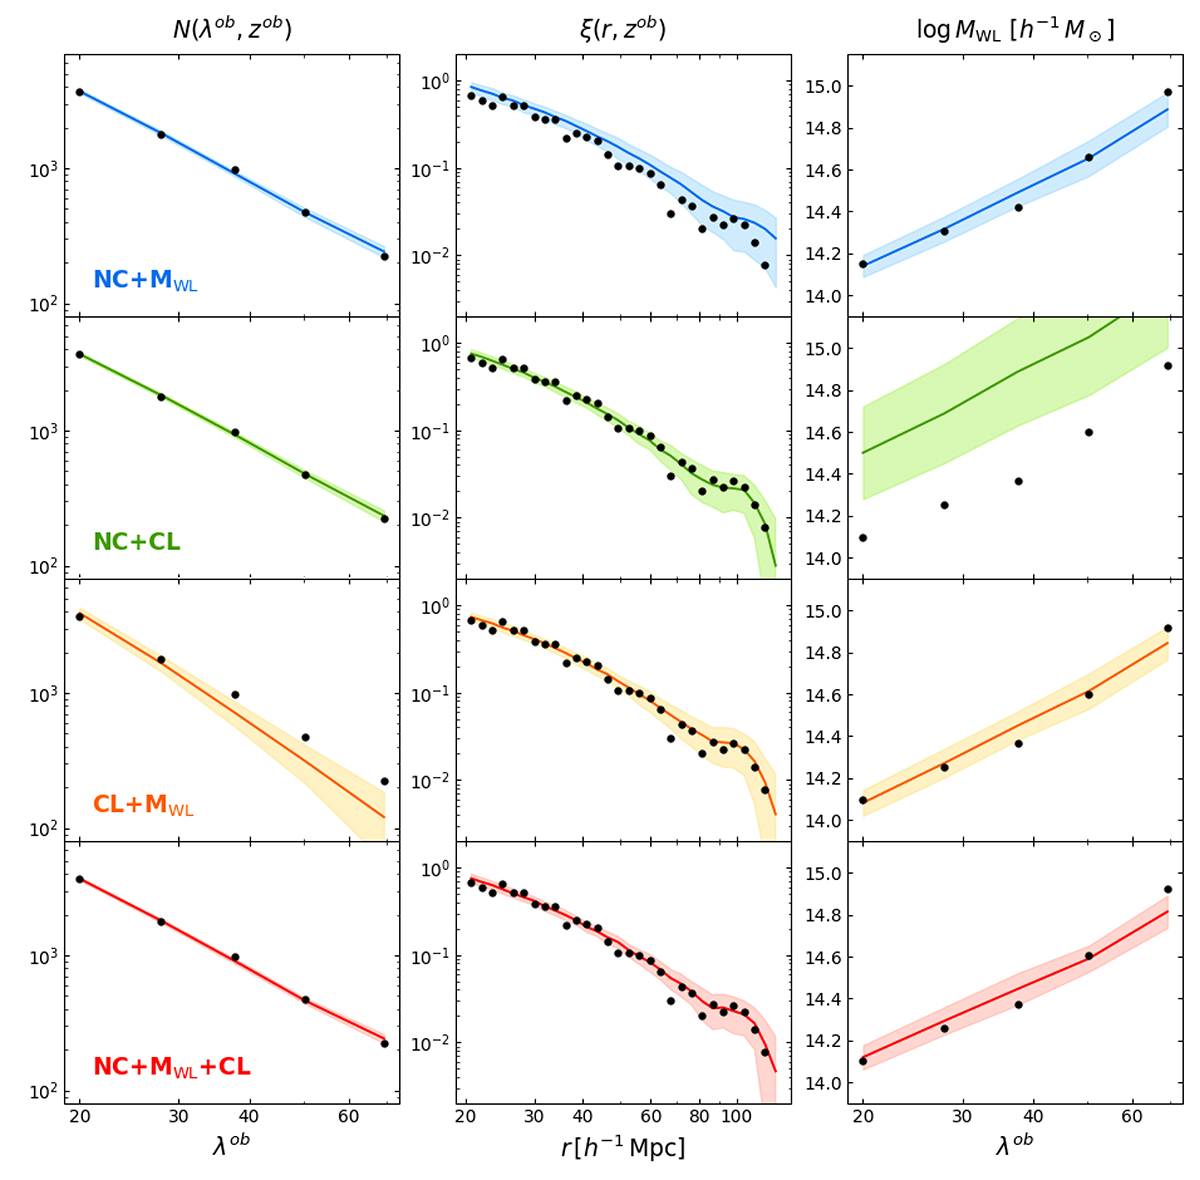
Fig. 3.
Download original image
Observed number counts (left), two-point correlation function (middle), and weak-lensing masses (right), compared to the corresponding predicted quantities evaluated at the best-fit cosmology of the contours in Fig. 1 (same color code). The black dots are the observed points, and the colored lines and shaded areas represent the mean and standard deviation of each statistics, respectively, evaluated at 100 cosmologies that were randomly extracted from the posterior distribution, convoluted with the covariance matrix through a multivariate Gaussian distribution.
Current usage metrics show cumulative count of Article Views (full-text article views including HTML views, PDF and ePub downloads, according to the available data) and Abstracts Views on Vision4Press platform.
Data correspond to usage on the plateform after 2015. The current usage metrics is available 48-96 hours after online publication and is updated daily on week days.
Initial download of the metrics may take a while.