Open Access
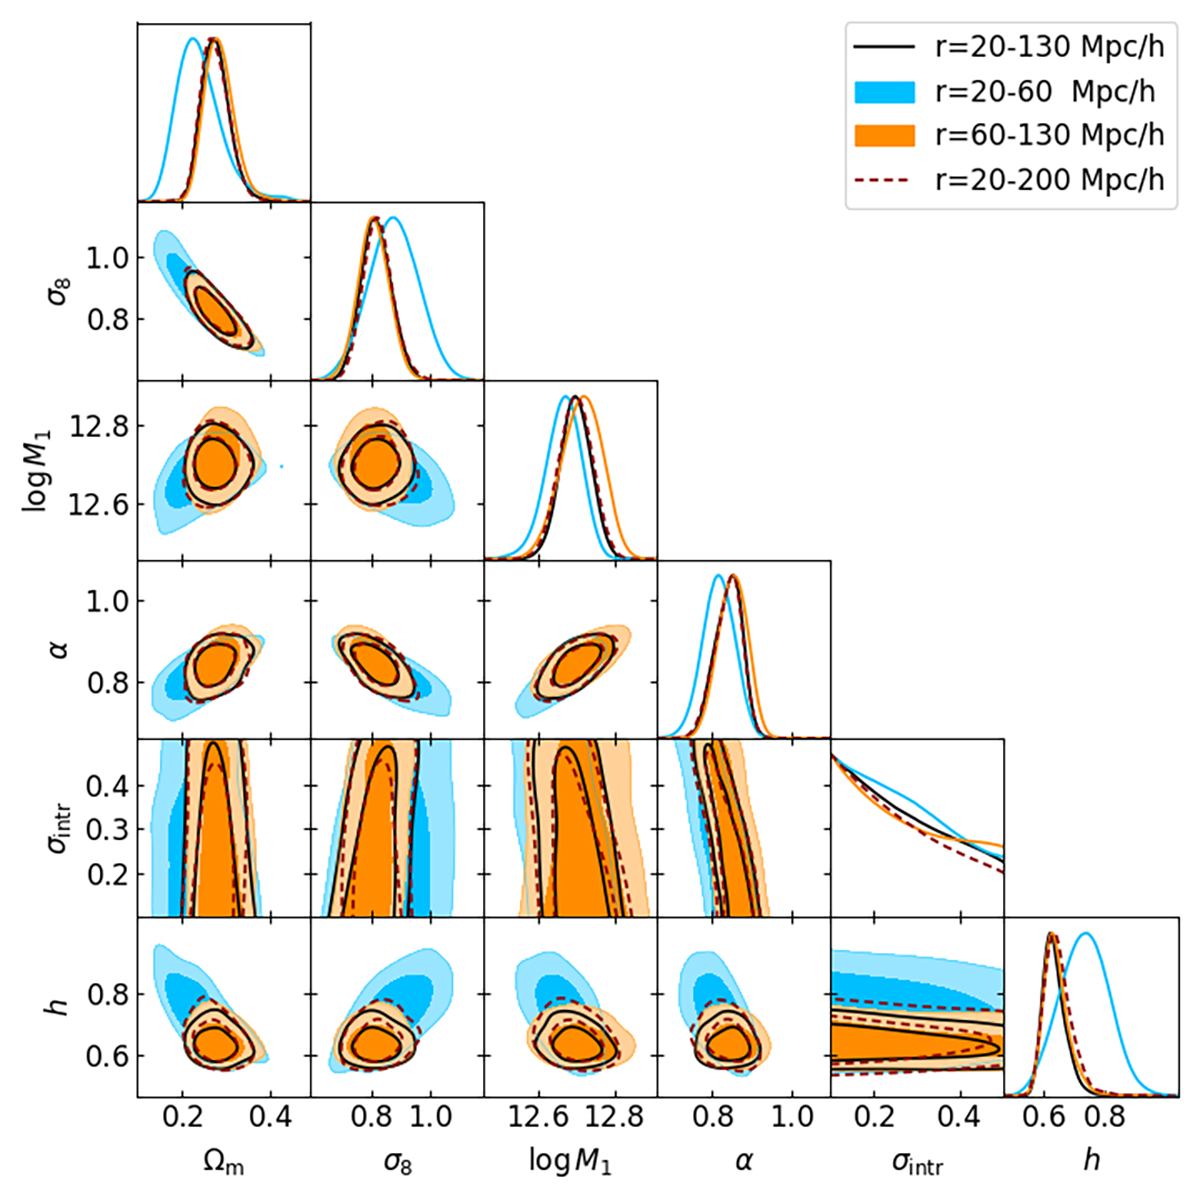
Fig. C.1.
Download original image
Contour plots at the 68 and 95 percent of confidence level, corresponding to different separation ranges in the cluster clustering modeling. In all the cases, the contours correspond to the NC+MWL+CL combination.
Current usage metrics show cumulative count of Article Views (full-text article views including HTML views, PDF and ePub downloads, according to the available data) and Abstracts Views on Vision4Press platform.
Data correspond to usage on the plateform after 2015. The current usage metrics is available 48-96 hours after online publication and is updated daily on week days.
Initial download of the metrics may take a while.