Fig. 1.
Download original image
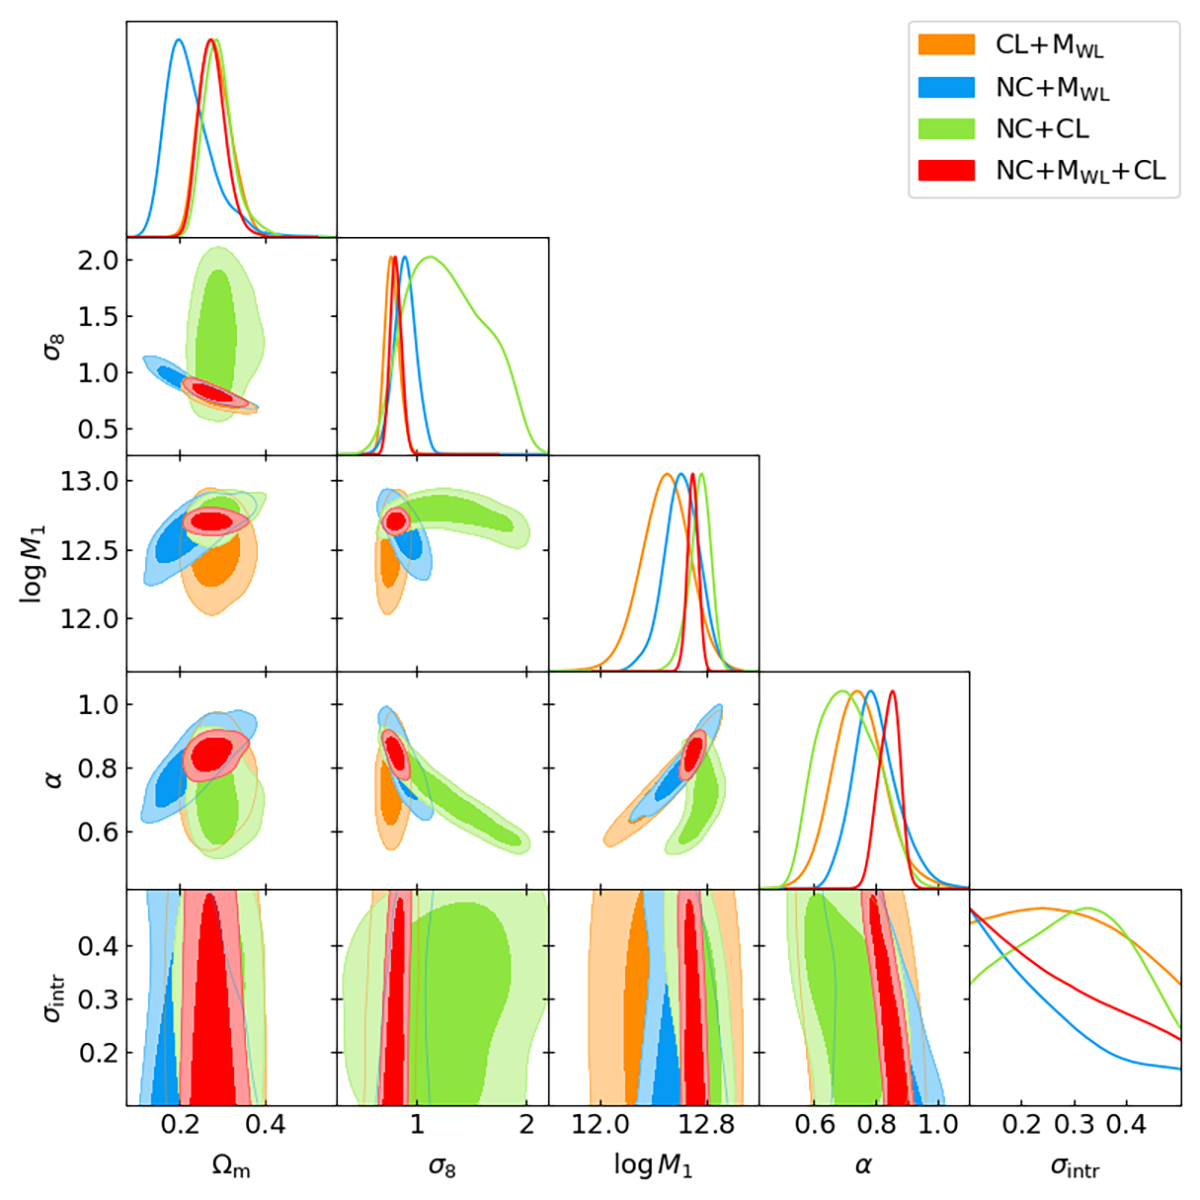
Contour plots at 68 and 95% of confidence level for different observable combinations. The number counts and weak-lensing masses are plotted in blue, the number counts and clustering are shown in green, the clustering and weak-lensing masses are shown in orange, and all the three probes are shown in red. The posteriors are obtained by marginalizing over the other parameters listed in Table 1; σ8 is a derived parameter. We only show the parameter posteriors that are not dominated by a prior.
Current usage metrics show cumulative count of Article Views (full-text article views including HTML views, PDF and ePub downloads, according to the available data) and Abstracts Views on Vision4Press platform.
Data correspond to usage on the plateform after 2015. The current usage metrics is available 48-96 hours after online publication and is updated daily on week days.
Initial download of the metrics may take a while.