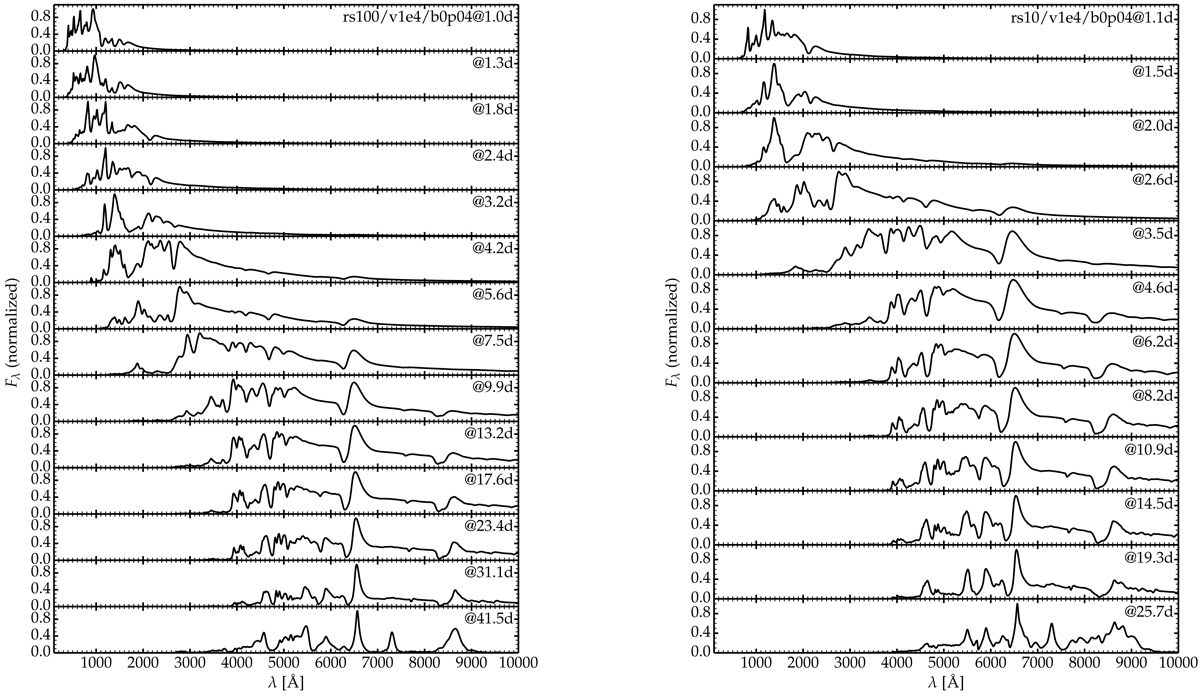
Fig. 6.
Download original image
Spectral evolution for models rs100/v1e4/b0p04 (left) and rs10/v1e4/b0p04 (right). Although the time step adopted in our CMFGEN simulations is 10% of the current time, we show spectra here with an increment of about 30% of the current time (i.e., epochs shown are 1, 1.3, 1.8 d etc.). At each epoch, the spectra are normalized to a maximum flux of unity.
Current usage metrics show cumulative count of Article Views (full-text article views including HTML views, PDF and ePub downloads, according to the available data) and Abstracts Views on Vision4Press platform.
Data correspond to usage on the plateform after 2015. The current usage metrics is available 48-96 hours after online publication and is updated daily on week days.
Initial download of the metrics may take a while.