Fig. A.1
Download original image
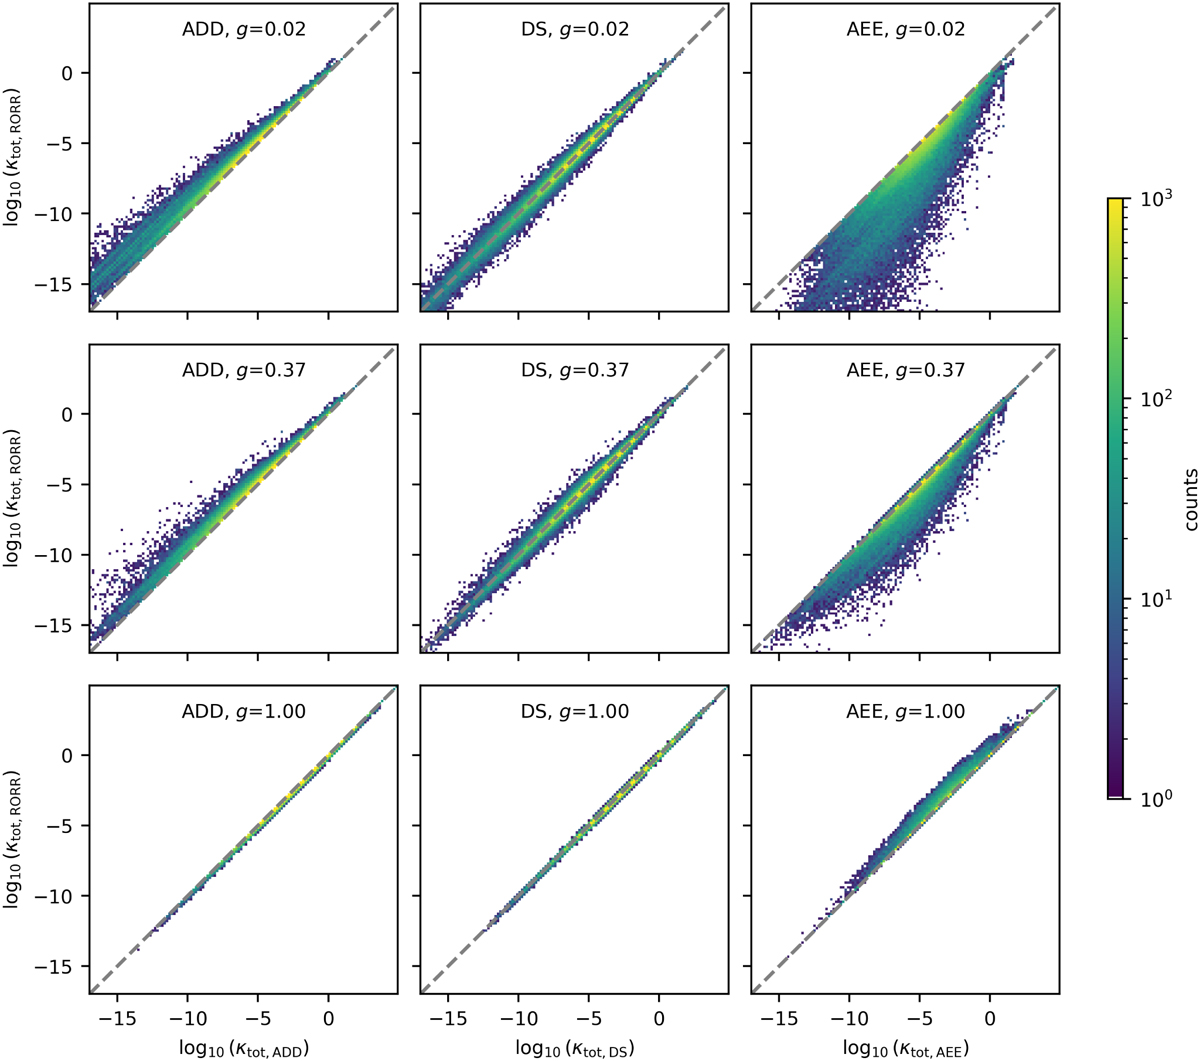
Mixed κtot values as a result of using different methods (x-axis, columns) compared to the respective values using the RORR method (y-axis) for three different g values (rows). The data points are taken from the counterpart of the training set, used to train the DS method (see Sect. 2.5). The density of points is logarithmically color-coded.
Current usage metrics show cumulative count of Article Views (full-text article views including HTML views, PDF and ePub downloads, according to the available data) and Abstracts Views on Vision4Press platform.
Data correspond to usage on the plateform after 2015. The current usage metrics is available 48-96 hours after online publication and is updated daily on week days.
Initial download of the metrics may take a while.