Fig. 9
Download original image
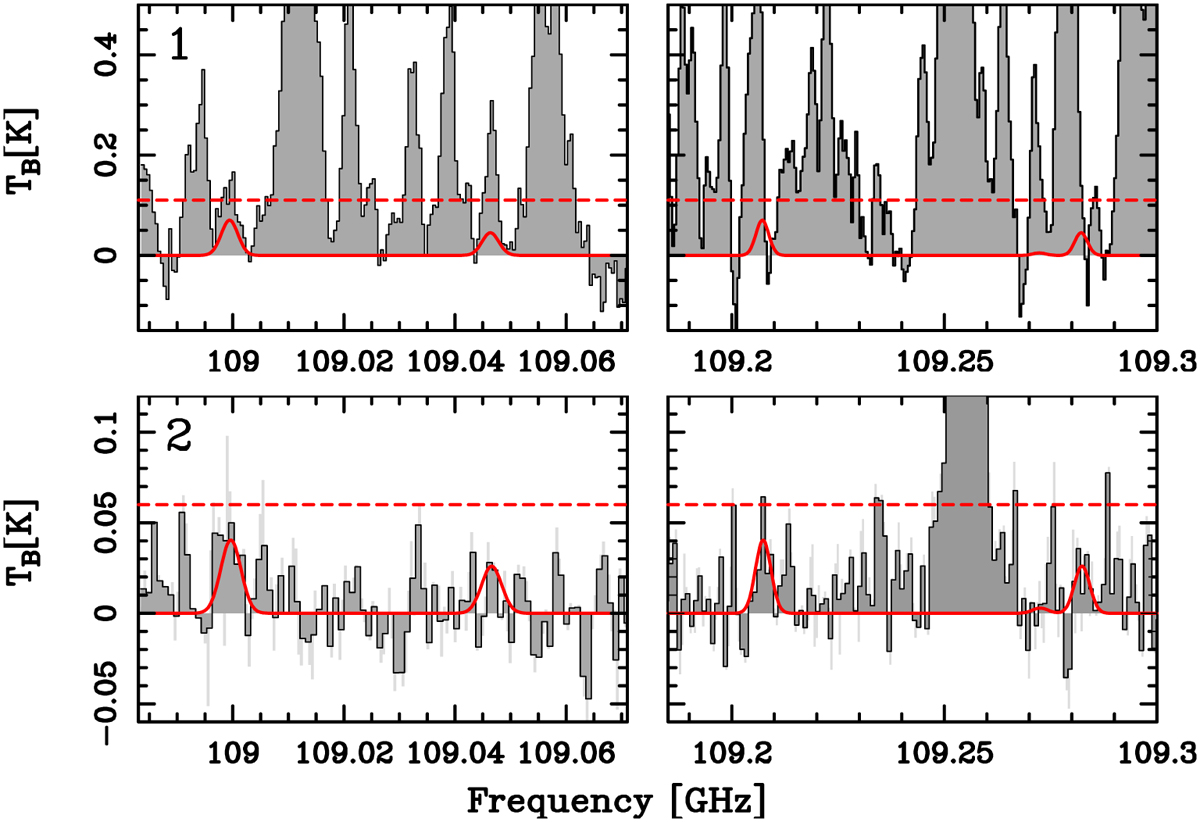
Spectra containing the PO lines in the GUAPOS observations. Upper panel: spectrum extracted towards region 1. The red curve indicates the PO lines fitted according to the best-fit parameters in Table 2 (assuming Tex=26 K). The horizontal red dashed line corresponds to the 3σ rms level. Lower panel: same as top panel for region 2, using the fit shown in Table 2, where Tex=12 K is assumed. The observed spectra at the original frequency resolution are shown in light grey, while the spectra smoothed by a factor of 2 are shown in dark grey.
Current usage metrics show cumulative count of Article Views (full-text article views including HTML views, PDF and ePub downloads, according to the available data) and Abstracts Views on Vision4Press platform.
Data correspond to usage on the plateform after 2015. The current usage metrics is available 48-96 hours after online publication and is updated daily on week days.
Initial download of the metrics may take a while.