Fig. 8
Download original image
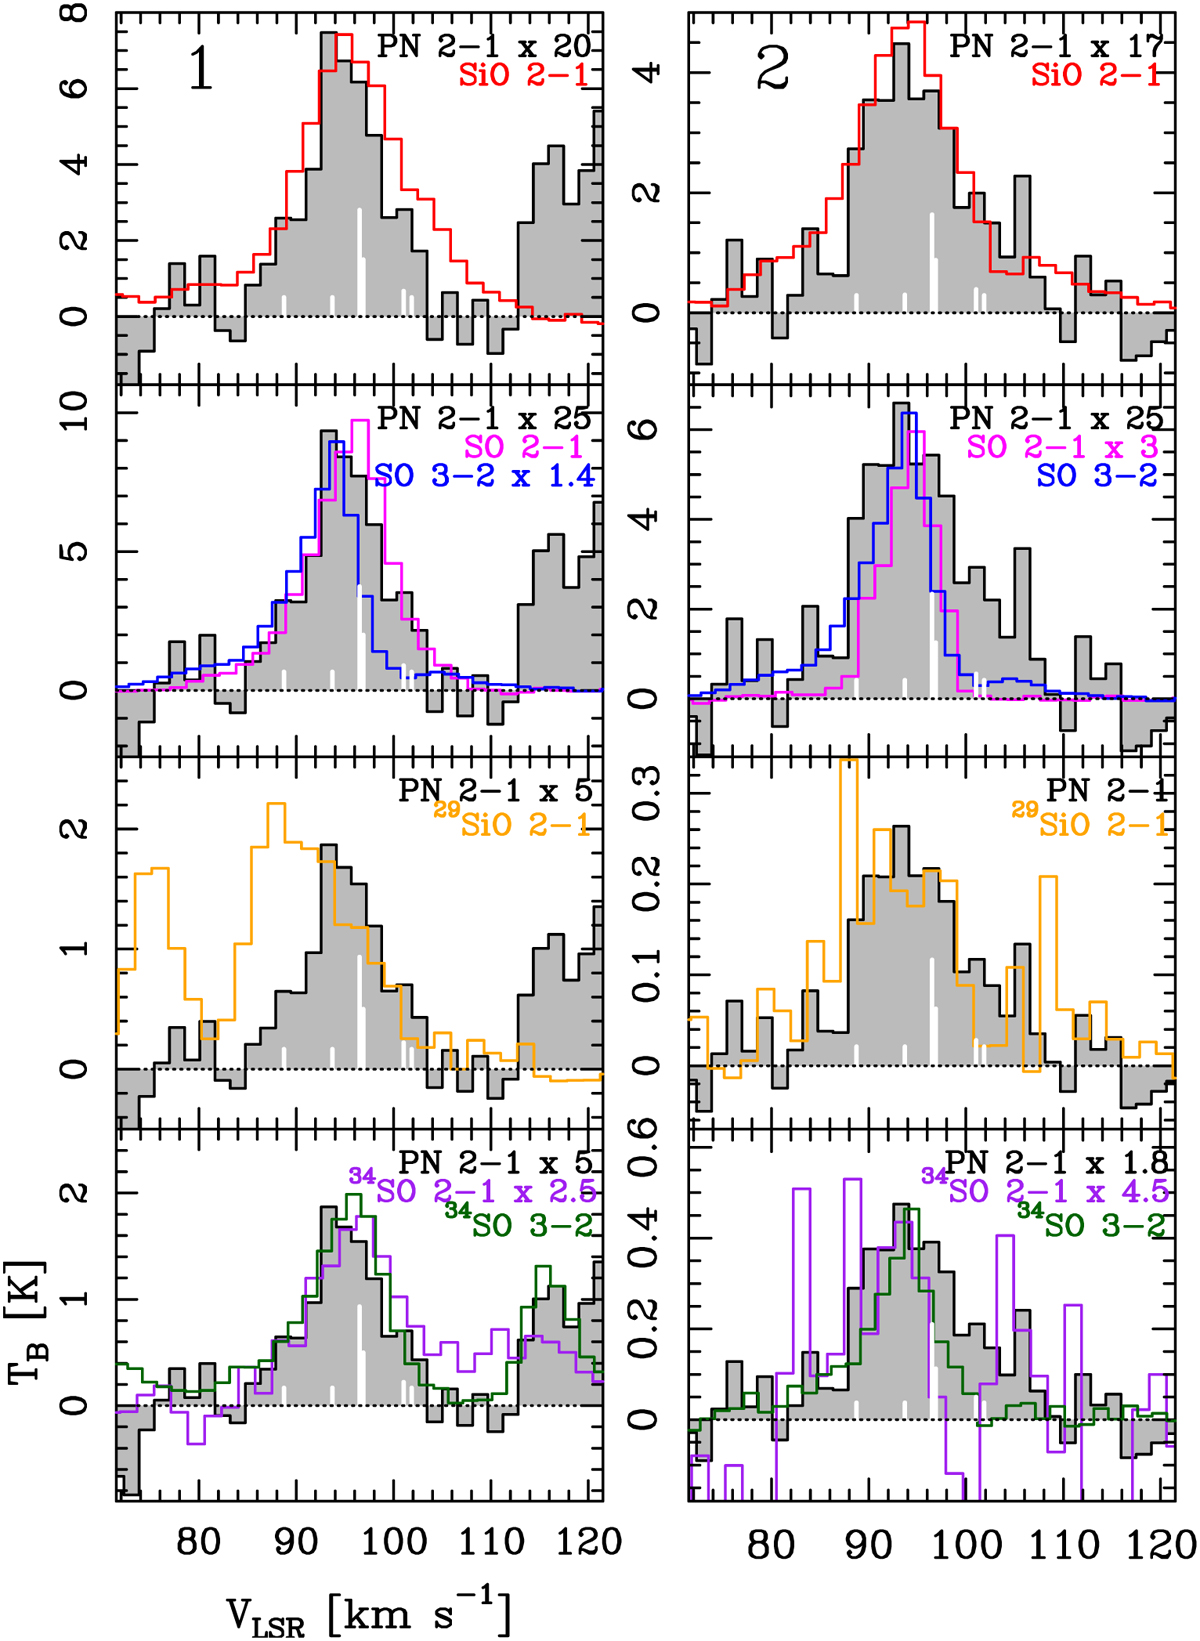
Spectral comparison between PN, SiO, and SO. The PN J = 2−1 spectra (grey histogram) extracted from regions 1 and 2 in Fig. 1 are superimposed on SiO J = 2−1 (red histograms), SO N = 2-1(2) (magenta histograms), SO N = 3−2 (blue histograms), 29SiO J = 2-1 (orange histograms), 34SO N = 2−1(2) (purple histograms), and 34SO N = 3-2 (green histograms) extracted from the same regions. The PN line intensity scale has been appropriately multiplied to perform a consistent spectral comparison with SiO and SO. In each plot, the white vertical bars are the theoretical positions in velocity of the PN J = 2−1 hyperfine components (Table 1), with the strongest one being at the systemic velocity of 96.5 km s−1.
Current usage metrics show cumulative count of Article Views (full-text article views including HTML views, PDF and ePub downloads, according to the available data) and Abstracts Views on Vision4Press platform.
Data correspond to usage on the plateform after 2015. The current usage metrics is available 48-96 hours after online publication and is updated daily on week days.
Initial download of the metrics may take a while.