Open Access
Fig. 7
Download original image
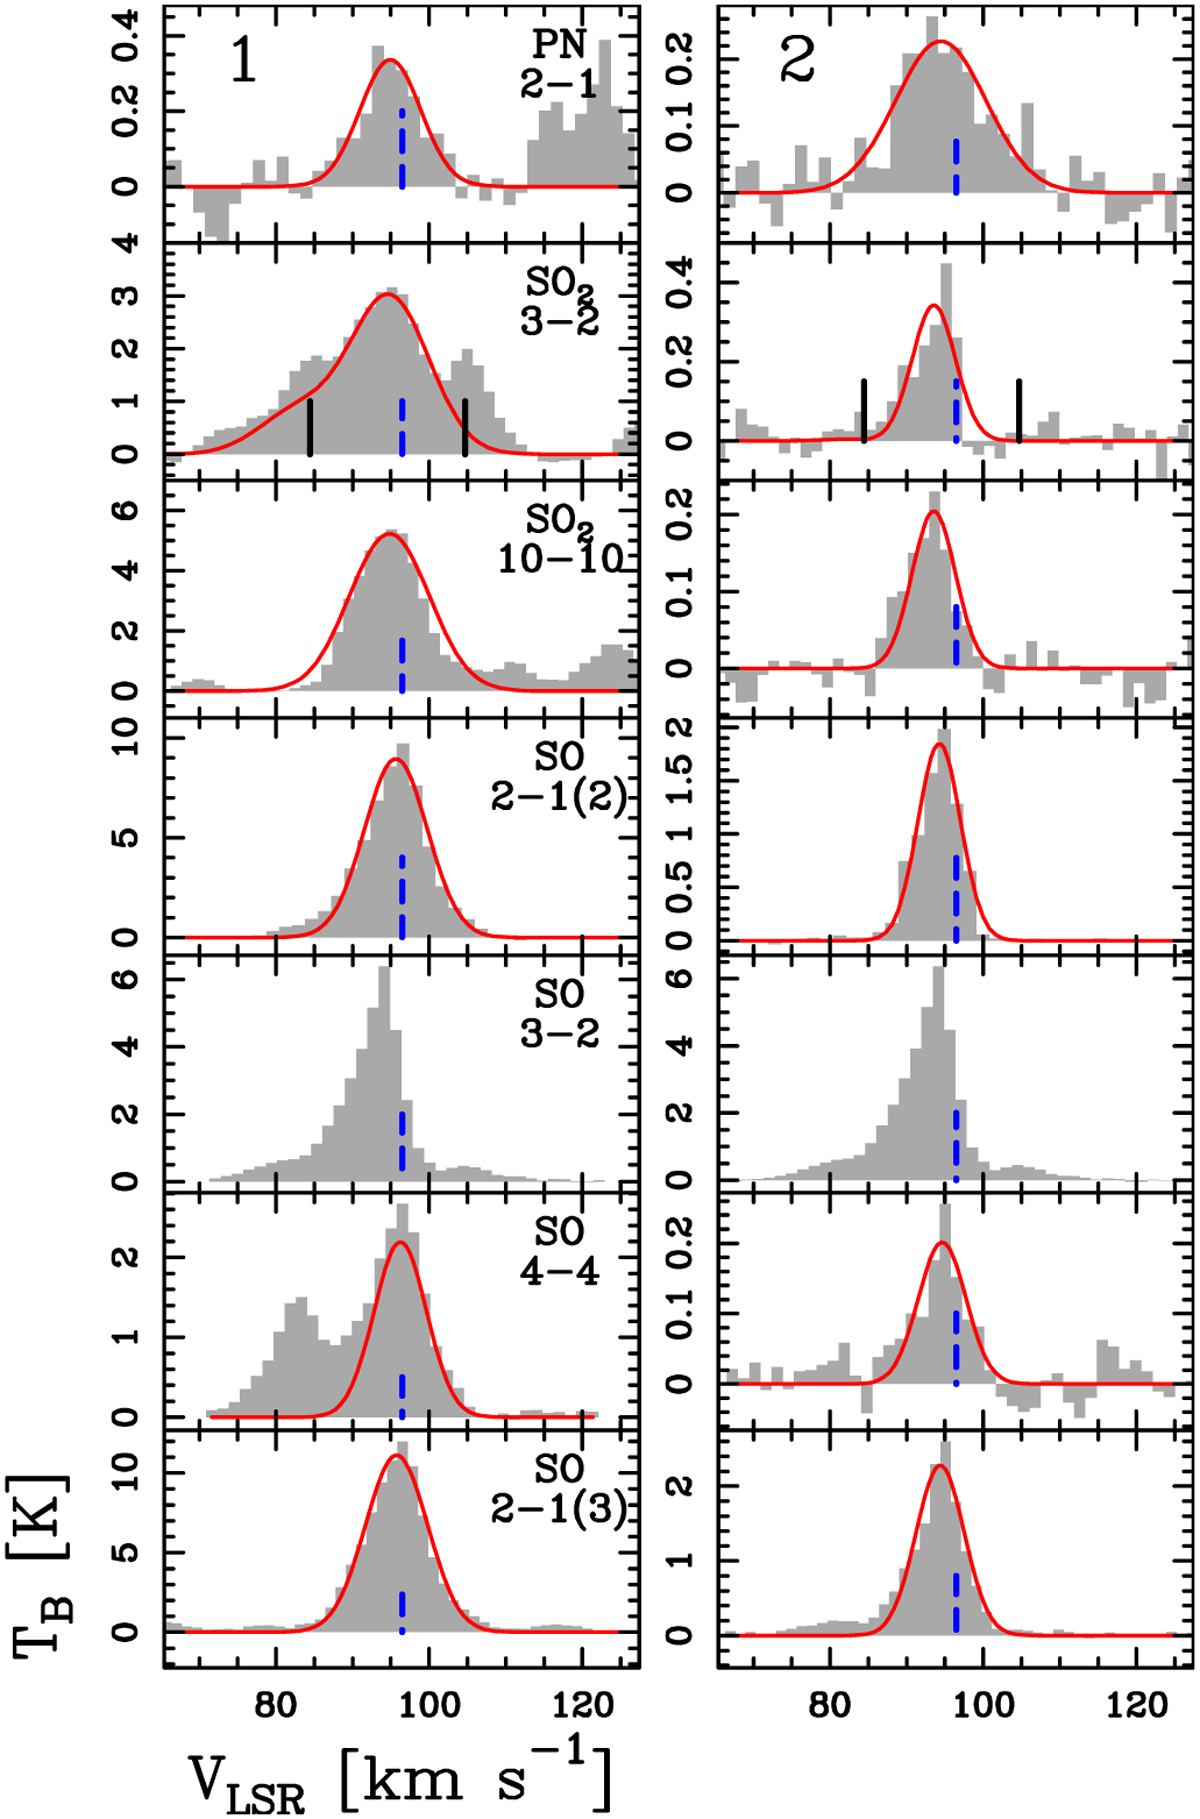
As in Fig. 6, but showing the spectra of SO2 (J = 3−2 and J = 10 − 10) and SO (J = 2−1, J = 3−2, and J = 4−4). We keep the spectra of PN for reference in the top panels, as in Fig. 6. The black vertical lines in the spectrum of SO2 J = 3−2 are SO2 J = 16 − 15 (Table 1) and 13CH3OH J = 13 − 14 at 104.0266 GHz.
Current usage metrics show cumulative count of Article Views (full-text article views including HTML views, PDF and ePub downloads, according to the available data) and Abstracts Views on Vision4Press platform.
Data correspond to usage on the plateform after 2015. The current usage metrics is available 48-96 hours after online publication and is updated daily on week days.
Initial download of the metrics may take a while.