Fig. 6
Download original image
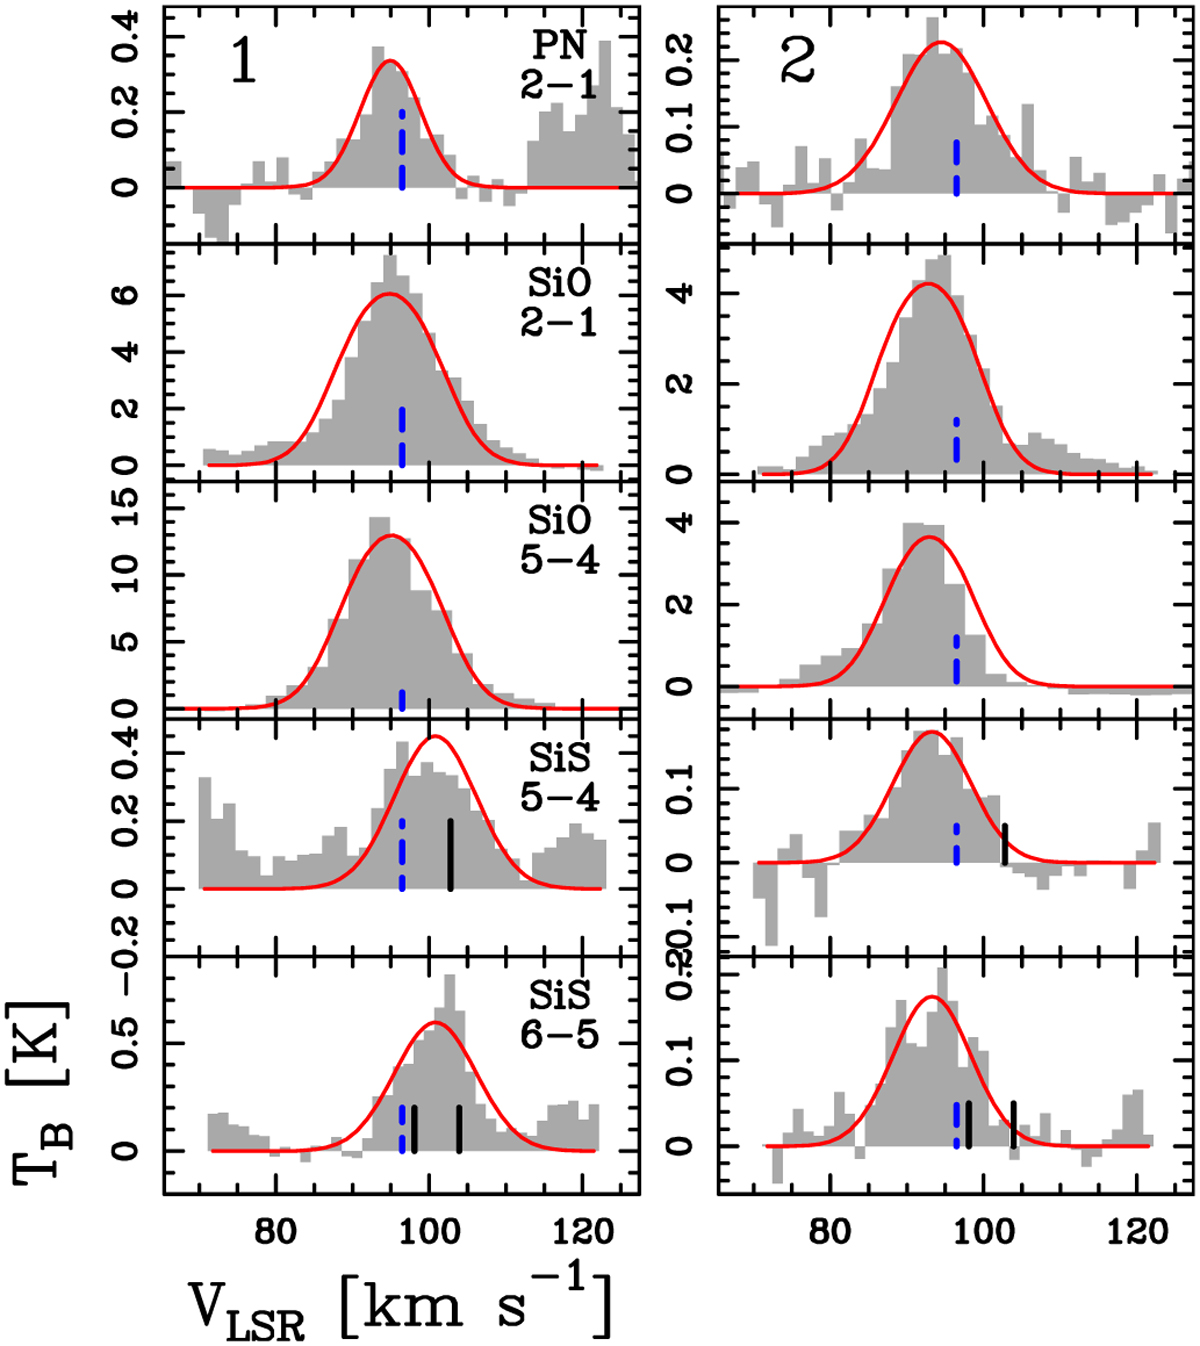
Spectra extracted from the regions detected in PN J = 2−1. We show the transitions (from top to bottom) of PN (J = 2−1), SiO (J = 2−1 and J = 5−4) and SiS (J = 5−4 and J = 6−5). At the top of each column, we give the number of the extraction region according to the labels in Fig. 1. The blue dashed vertical lines correspond to the reference LSR velocity (96.5 km s−1; Mininni et al. 2020). The black vertical lines in the panels of the SiS J = 5−4 line correspond to an unidentified line detected in the hot core at 90.7697 GHz, and those of the J = 6−5 transition correspond to CH3COCH3 at 108.9237 GHz and to an unidentified line at 108.9216 GHz, both detected in the hot core (Mininni et al. 2023). The red curves superimposed on the lines represent the best LTE fit of the analysed molecules obtained with MAD-CUBA. For PN, we show the fit obtained fixing Tex to that of SiO, that is 26 K (see Sect. 3.3.2).
Current usage metrics show cumulative count of Article Views (full-text article views including HTML views, PDF and ePub downloads, according to the available data) and Abstracts Views on Vision4Press platform.
Data correspond to usage on the plateform after 2015. The current usage metrics is available 48-96 hours after online publication and is updated daily on week days.
Initial download of the metrics may take a while.