Fig. 5
Download original image
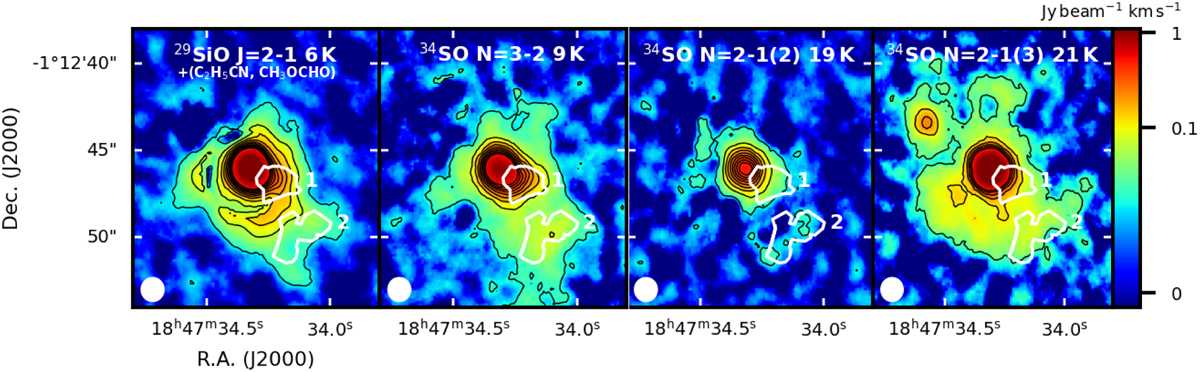
Velocity-integrated emission of less abundant isotopologues. We show, from left to right, 29SiO J = 2−1, 34SO N = 3−2, N = 2−1(2), and N = 2−1(3). The integration velocity range is 85-101 km s−1 for 29SiO, which is the range in which PN and 29SiO are both detected. For 34SO, we used: 81–105 for the N = 3−2 line, 88–104 km s−1 for the N = 2−1(2) line, and 85.7–105.8 km s−1 for the N = 2−1(3) line. The black contours start at the 3σ rms level of the integrated intensity maps, which is, from left to right, 1.6 × 10⁻² Jy beam−1 km s−1 ; 1.8 × 10⁻² Jy beam−1 km s−1 ; 1.7 × 10⁻² Jy beam−1 km s−1 ; and 8.7 × 10⁻³ Jy beairr1 km s−1, and the step is 10σ rms. The white contour corresponds to the 3σ rms level of the integrated map of PN, and the numbered regions 1 and 2 are those defined in Fig. 1. The synthesised beam is illustrated in the bottom-left corner.
Current usage metrics show cumulative count of Article Views (full-text article views including HTML views, PDF and ePub downloads, according to the available data) and Abstracts Views on Vision4Press platform.
Data correspond to usage on the plateform after 2015. The current usage metrics is available 48-96 hours after online publication and is updated daily on week days.
Initial download of the metrics may take a while.