Fig. 4
Download original image
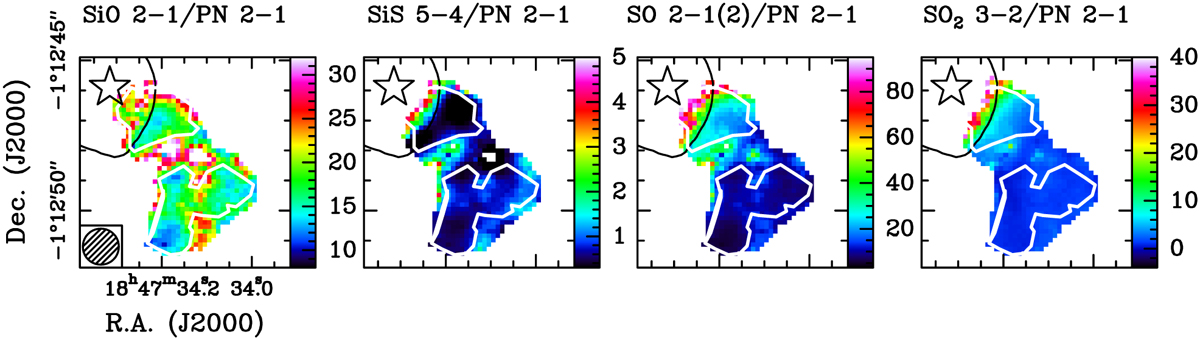
Maps of integrated intensity ratios. The plots show the ratio between the PN integrated intensity and that of, from left to right, SiO J = 2−1. SiS J = 5−4, SO J = 2−1(2), and ![]() . We show only the emission included in or close to the two PN-emitting regions 1 and 2, as the PN integrated emission goes rapidly to zero elsewhere. The star in the top left corner indicates the phase centre, and the ellipse in the bottom left corner in the first panel is the GUAPOS synthesised beam. The black and white contours correspond to the 3 mm continuum emission and the PN integrated emission, respectively, as shown in Fig. 1.
. We show only the emission included in or close to the two PN-emitting regions 1 and 2, as the PN integrated emission goes rapidly to zero elsewhere. The star in the top left corner indicates the phase centre, and the ellipse in the bottom left corner in the first panel is the GUAPOS synthesised beam. The black and white contours correspond to the 3 mm continuum emission and the PN integrated emission, respectively, as shown in Fig. 1.
Current usage metrics show cumulative count of Article Views (full-text article views including HTML views, PDF and ePub downloads, according to the available data) and Abstracts Views on Vision4Press platform.
Data correspond to usage on the plateform after 2015. The current usage metrics is available 48-96 hours after online publication and is updated daily on week days.
Initial download of the metrics may take a while.