Fig. 3
Download original image
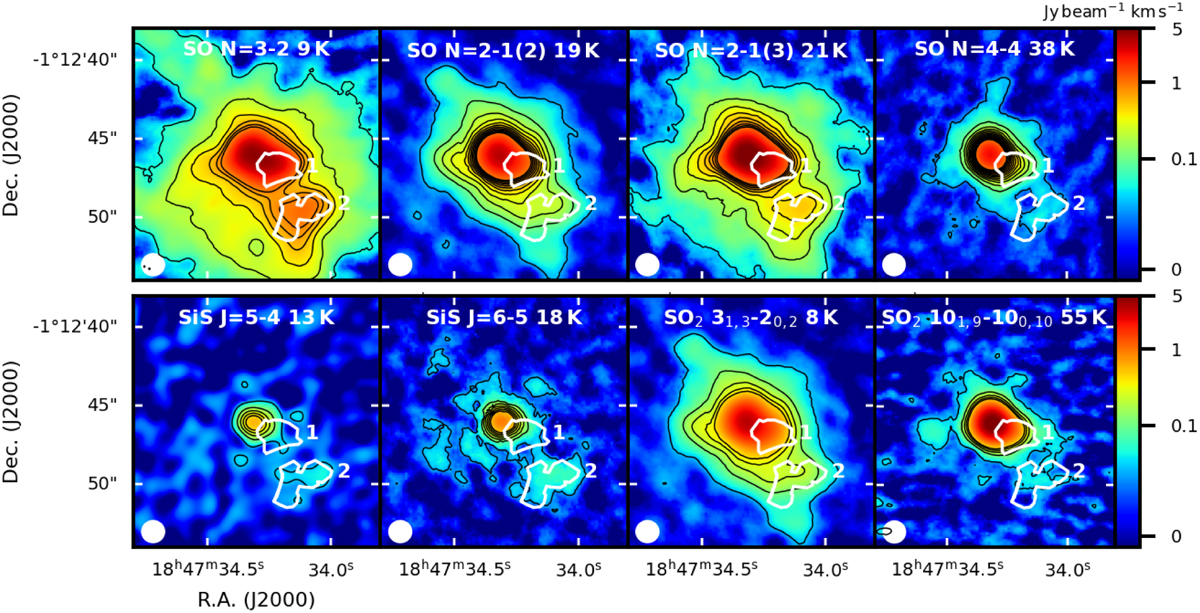
Emission of SO, SiS, and SO2 integrated in velocity. Upper panels: velocity-integrated emission of, from left to right, SO N = 3−2, N = 2−1(2), N = 2−1(3), and N = 4−4 (see Table 1 for the spectral parameters). The integration velocity range is 85.7–105.8 km s−1 in all images to match the velocity interval where the PN emission is detected. The black contours start from the 3σ rms level of the integrated maps, which is, from left to right: 4.8 × 10⁻² Jy beam−1 km s−1; 2.5 × 10⁻² Jy beam−1 kms−1; 3.6 × 10⁻² Jy beam−1 kms−1; 2.7 × 10⁻² Jy beam−1 km s−1, and the step is of 10σ rms. The white contour corresponds to the PN integrated emission, and the numbered regions 1 and 2 are those defined in Fig. 1. The synthesised beam is illustrated in the lower-left corner. To the right of the quantum numbers, we indicate the Eup of the transition. Lower panels: same as the upper panels for the SiS J = 5−4 and J = 6−5 lines, and the ![]() and
and ![]() lines. The 3σ rms level is: 2.9 × 10⁻² Jy beam−1 km s−1 for SiS J = 5−4; 2.3 × 10⁻² Jy beam−1 km s−1 for SiS J = 6−5; 2.95 × 10⁻³ Jy beam−1 km s−1 for
lines. The 3σ rms level is: 2.9 × 10⁻² Jy beam−1 km s−1 for SiS J = 5−4; 2.3 × 10⁻² Jy beam−1 km s−1 for SiS J = 6−5; 2.95 × 10⁻³ Jy beam−1 km s−1 for ![]() Jy beam−1 km s−1 for
Jy beam−1 km s−1 for ![]() .
.
Current usage metrics show cumulative count of Article Views (full-text article views including HTML views, PDF and ePub downloads, according to the available data) and Abstracts Views on Vision4Press platform.
Data correspond to usage on the plateform after 2015. The current usage metrics is available 48-96 hours after online publication and is updated daily on week days.
Initial download of the metrics may take a while.