Fig. 2
Download original image
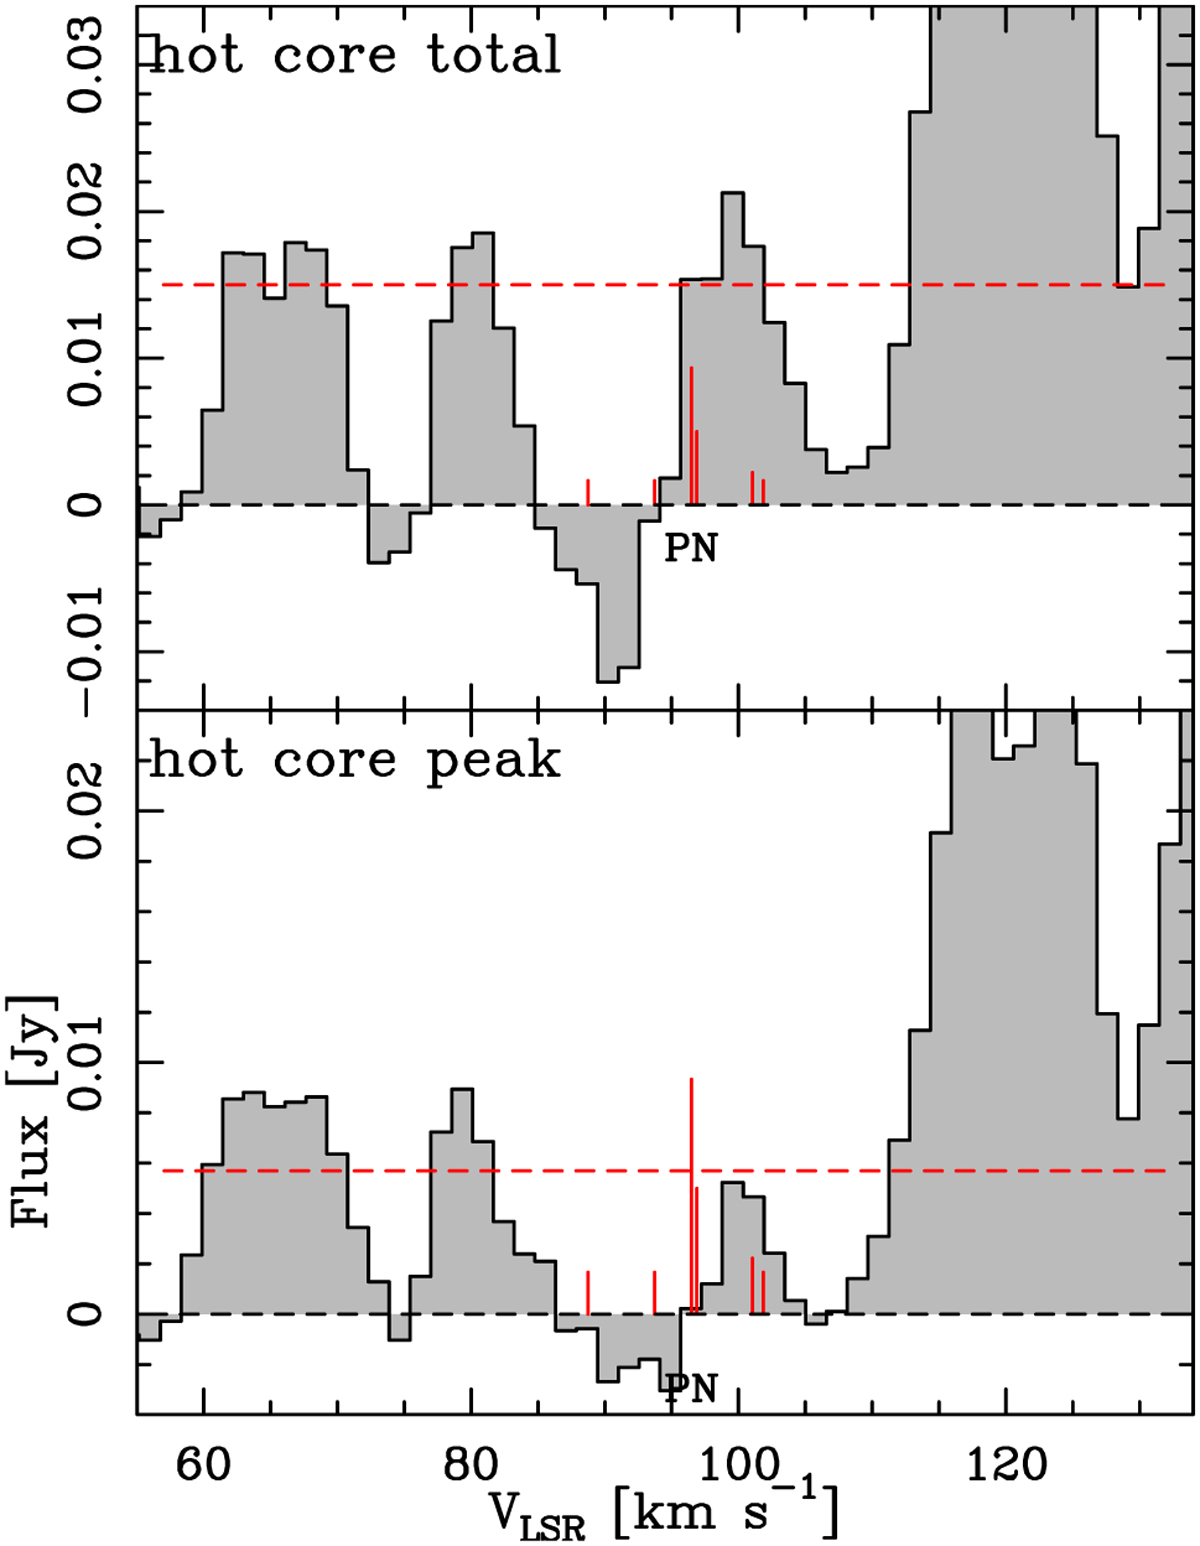
Integrated PN J = 2−1 spectrum extracted from the hot core. The upper panel shows the spectrum extracted from the 3 mm continuum contour shown in Fig. 1. The lower panel shows the spectrum extracted from a beam around the intensity peak of the 3 mm continuum. The red vertical lines indicate the expected velocities of the hyperfine components, and their length is proportional to the relative intensity of the components. The horizontal lines illustrate the 3σ rms level.
Current usage metrics show cumulative count of Article Views (full-text article views including HTML views, PDF and ePub downloads, according to the available data) and Abstracts Views on Vision4Press platform.
Data correspond to usage on the plateform after 2015. The current usage metrics is available 48-96 hours after online publication and is updated daily on week days.
Initial download of the metrics may take a while.