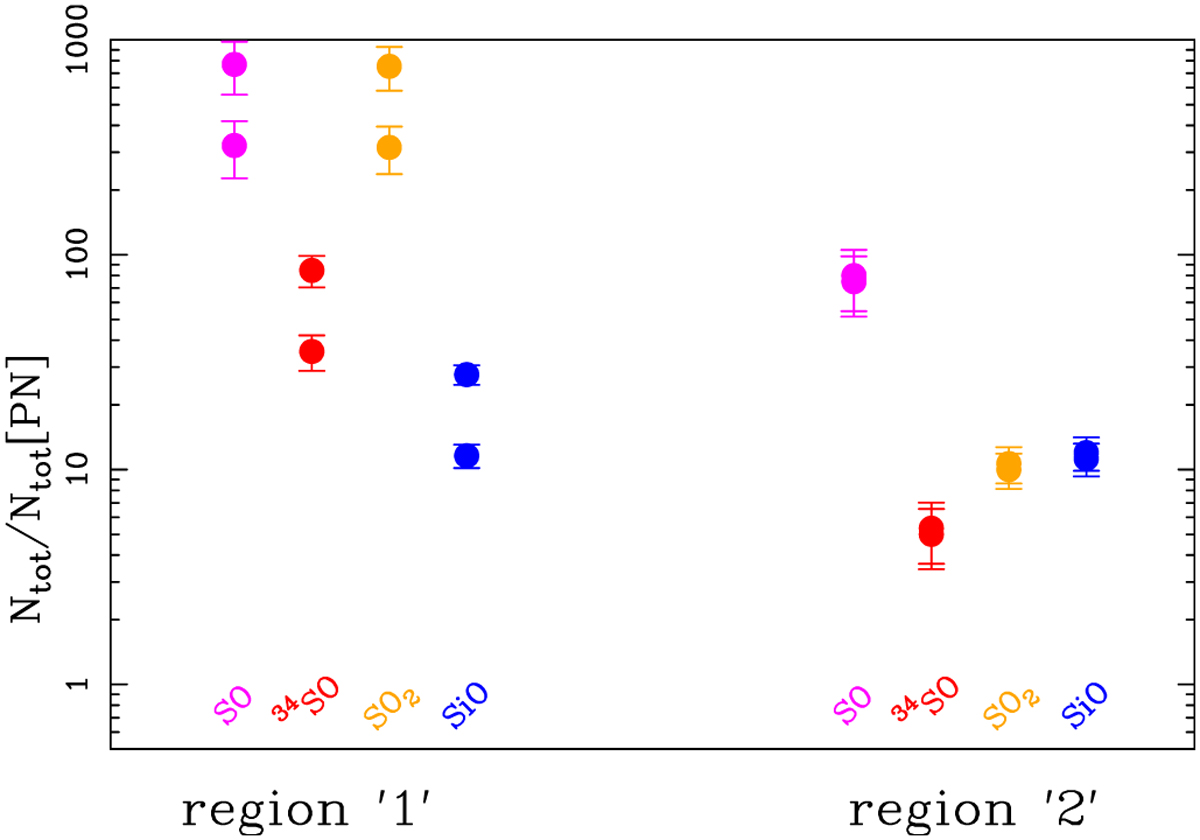
Fig. 11
Download original image
Column density ratios between molecular species and PN. The different molecules are identified by different colours, and the measurements obtained in regions 1 and 2 are separated on the x-axis as indicated. For each molecule, we plot two values of Ntot/Ntot[PN], which correspond to the two Ntot[PN] obtained in the Tex velocity interval given in Sect. 3.3.2 (Table 2).
Current usage metrics show cumulative count of Article Views (full-text article views including HTML views, PDF and ePub downloads, according to the available data) and Abstracts Views on Vision4Press platform.
Data correspond to usage on the plateform after 2015. The current usage metrics is available 48-96 hours after online publication and is updated daily on week days.
Initial download of the metrics may take a while.