Fig. 1
Download original image
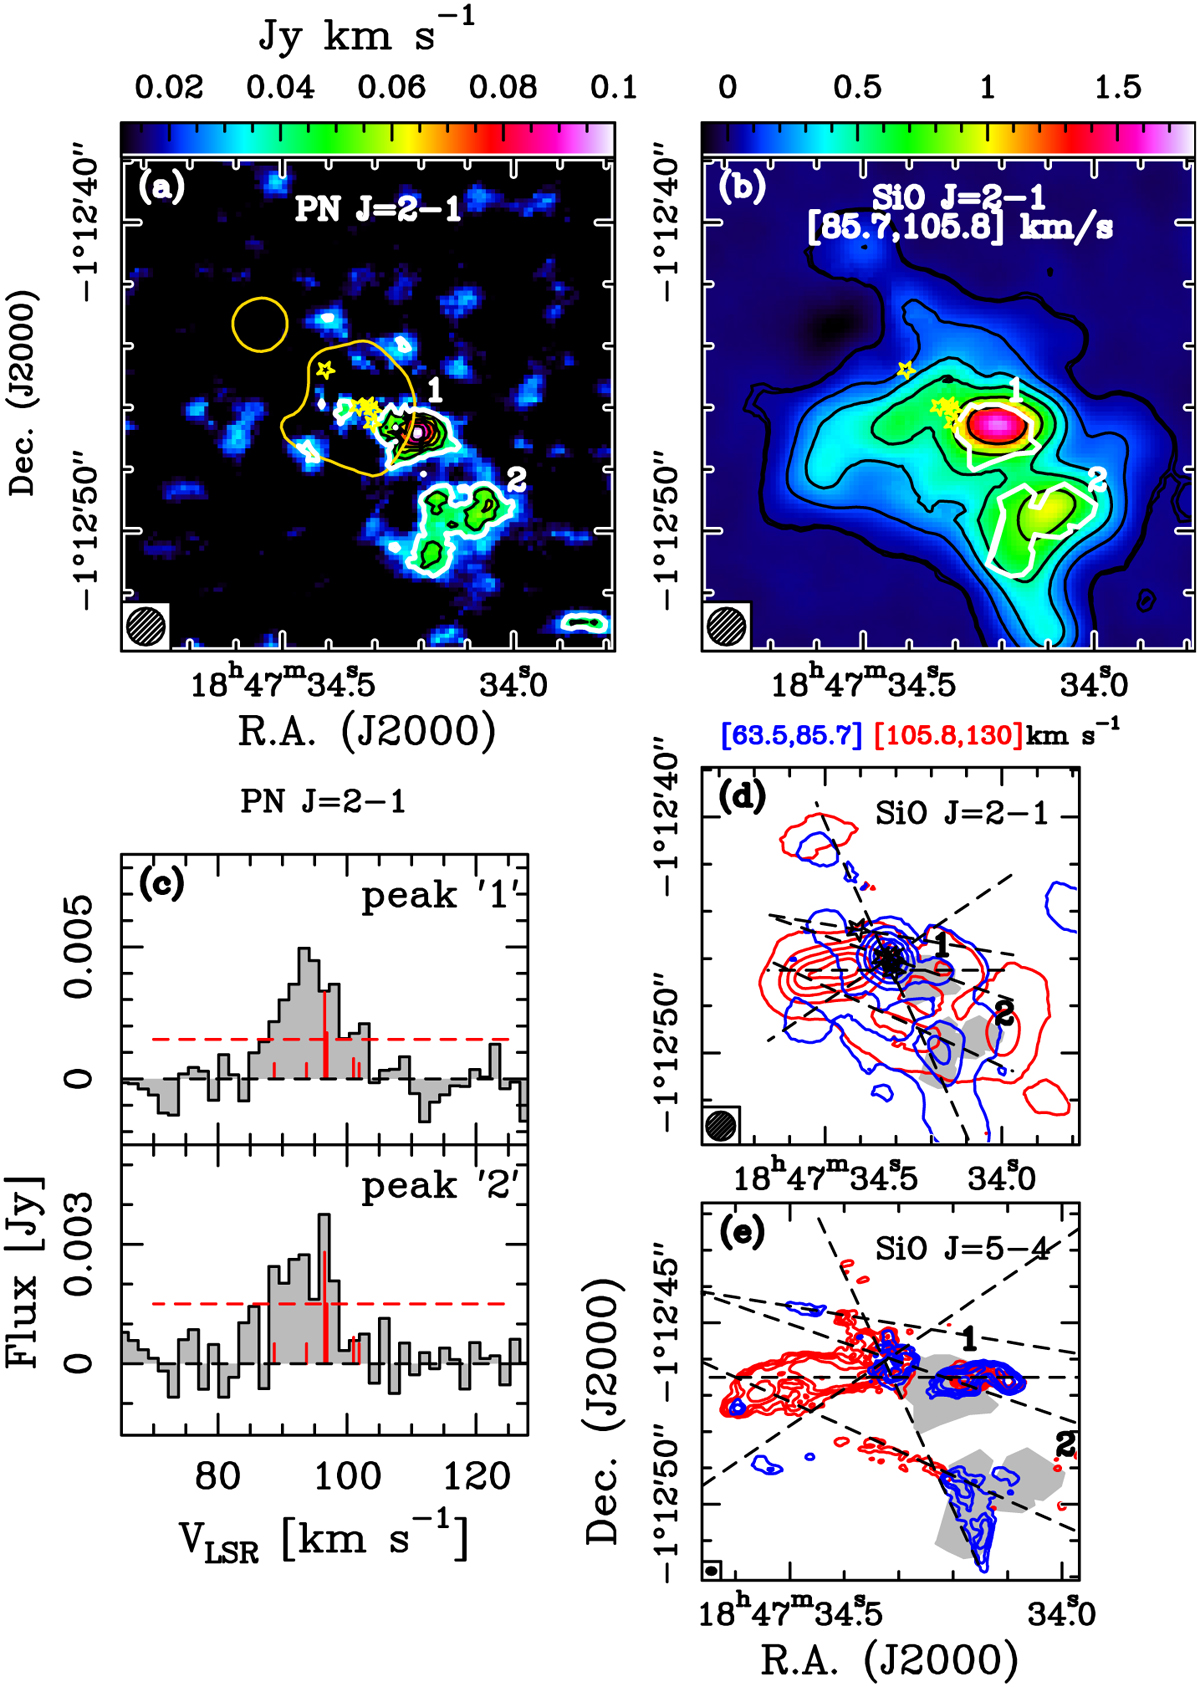
Intensity maps of PN and SiO integrated in velocity. (a) PN J = 2−1 integrated in the range 85.7–105.8 km s−1. The white contour is the 3σ rms level of the integrated map (σ = 1.14 × 10⁻² Jy km s−1 ), while the black contours are in steps of 1σ rms. The numbered regions 1 and 2 are those used to extract the spectra of all species analysed. The synthesised beam is in the bottom-left corner. The yellow contour is the 3 mm continuum emission at 16 mJy beam−1, corresponding to 20σ rms. The yellow stars indicate the continuum sources identified by Beltrán et al. (2021). (b) Map of the intensity of SiO J = 2 − 1 integrated in the same velocity range as PN (colour scale). The PN emission regions identified in panel a are highlighted in white. Contours start at the 3σ rms level of the integrated emission (3 × 10⁻² Jy kms−1 ), and correspond to 3, 15, 30, 50, 80, and 120σ. (c) Spectra of PN J = 2 − 1 extracted from the emission peak in regions 1 (upper panel) and 2 (lower panel). The red dashed horizontal line indicates the 3σ rms level, and the vertical lines show the position in velocity of the line hyperfine components. (d) SiO J = 2 − 1 emission integrated in the velocity ranges 63.5–85.7 km s−1 (blue contours) and 105.8–130.0 km s−1 (red contours). In both cases, the starting contour is the 3σ rms level of the integrated map (1.95 × 10⁻² Jy km s−1 for the red contours, 1.62 × 10⁻² Jy km s−1 for the blue contours), and the step is 25σ. The dashed lines correspond to the six outflows identified by Beltrán et al. (2022) from SiO J = 5 − 4. The grey filled areas correspond to the PN emission regions 1 and 2 identified in panel a. (e) Same as panel d but for SiO J = 5 − 4, obtained at an angular resolution of ~0.22″ with ALMA, and already published in Beltrán et al. (2018). The integration velocity intervals are the same as in panel d.
Current usage metrics show cumulative count of Article Views (full-text article views including HTML views, PDF and ePub downloads, according to the available data) and Abstracts Views on Vision4Press platform.
Data correspond to usage on the plateform after 2015. The current usage metrics is available 48-96 hours after online publication and is updated daily on week days.
Initial download of the metrics may take a while.