Fig. 6
Download original image
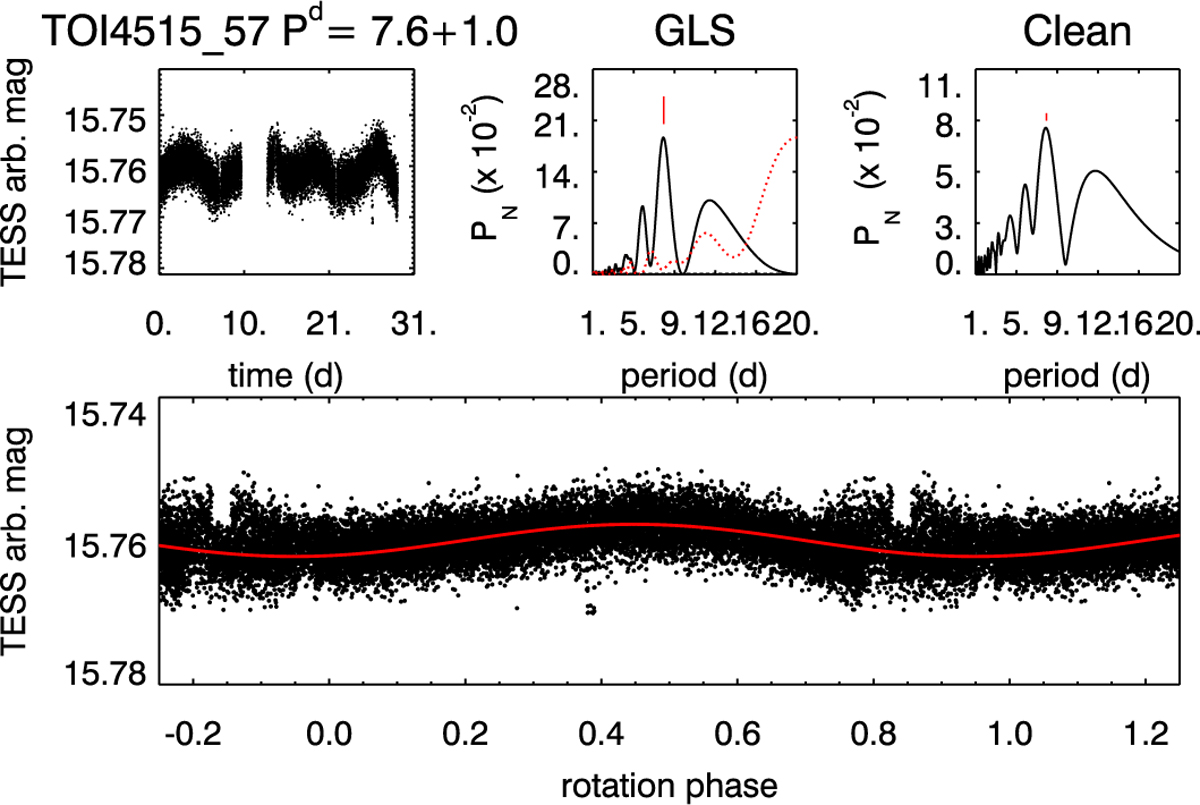
Results of the periodogram analysis of the TESS photometry (Sector 57) of TOI-4515. Top-left panel: photometric time series. Red vertical lines indicate the epochs of primary and secondary minimum. Top-middle panel: GLS periodogram (solid black line) with the window function overplotted (dotted red line). Top-right panel: CLEAN periodogram. Bottom panel: TESS light curve phased with the primary periodogram periodicity, that is with the 7.6 days half stellar rotation period.
Current usage metrics show cumulative count of Article Views (full-text article views including HTML views, PDF and ePub downloads, according to the available data) and Abstracts Views on Vision4Press platform.
Data correspond to usage on the plateform after 2015. The current usage metrics is available 48-96 hours after online publication and is updated daily on week days.
Initial download of the metrics may take a while.