Fig. 13

Download original image
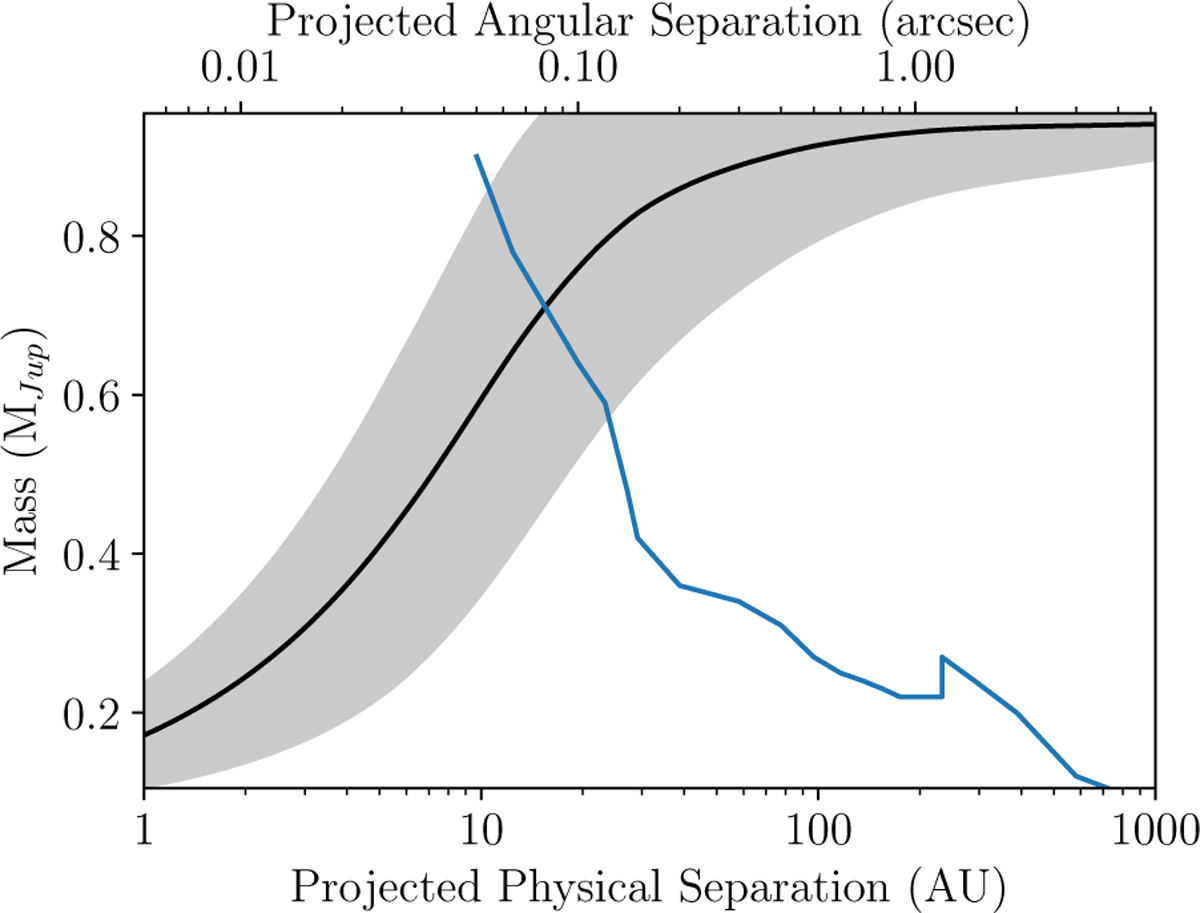
Constraints on the presence of companions from direct imaging and Gaia-Tycho2 proper motion differences. The detection limits from direct imaging, combining various datasets at different projected separations, are shown as a blue continuous line (the <200 AU region of the blue line comes from the speckle interferometry). The continuous black line shows the expected mass and projected separation of companions compatible with the nominal Gaia-Tycho2 proper motion difference, while the shaded gray area shows the lσ limits considering realistic distributions of orbital parameters.
Current usage metrics show cumulative count of Article Views (full-text article views including HTML views, PDF and ePub downloads, according to the available data) and Abstracts Views on Vision4Press platform.
Data correspond to usage on the plateform after 2015. The current usage metrics is available 48-96 hours after online publication and is updated daily on week days.
Initial download of the metrics may take a while.


