Fig. 11
Download original image
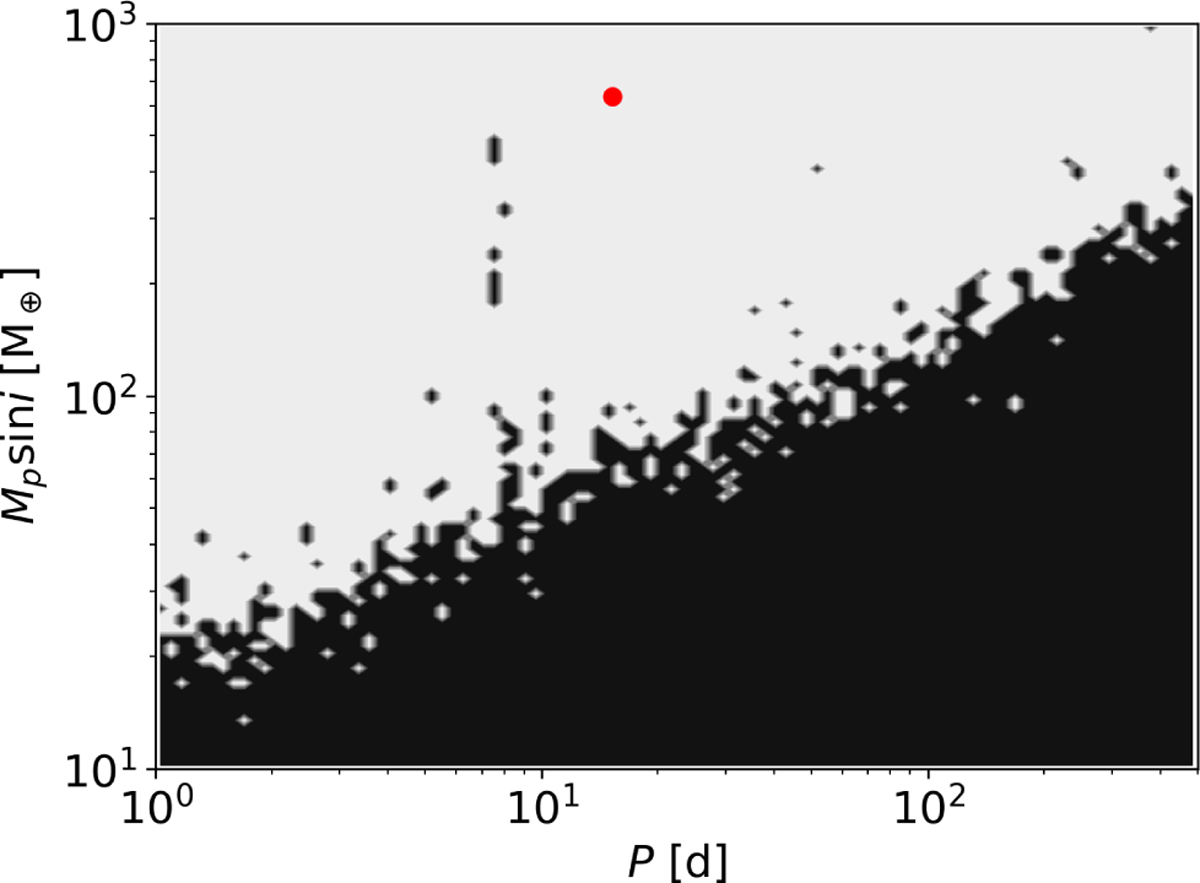
Detection function map of the RV time series of TOI-4515. The gray part corresponds to the area in the period–minimum mass space, where additional signals could be detected if present in the data, while the black region corresponds to the area where the detection probability is negligible. The red dot represents TOI-4515 b, for reference. At around P = 7.5 d, there are some low-sensitivity spots even at large masses, which are caused by the 1/2 aliases of Prot and Porb.
Current usage metrics show cumulative count of Article Views (full-text article views including HTML views, PDF and ePub downloads, according to the available data) and Abstracts Views on Vision4Press platform.
Data correspond to usage on the plateform after 2015. The current usage metrics is available 48-96 hours after online publication and is updated daily on week days.
Initial download of the metrics may take a while.