Open Access
Fig. 10
Download original image
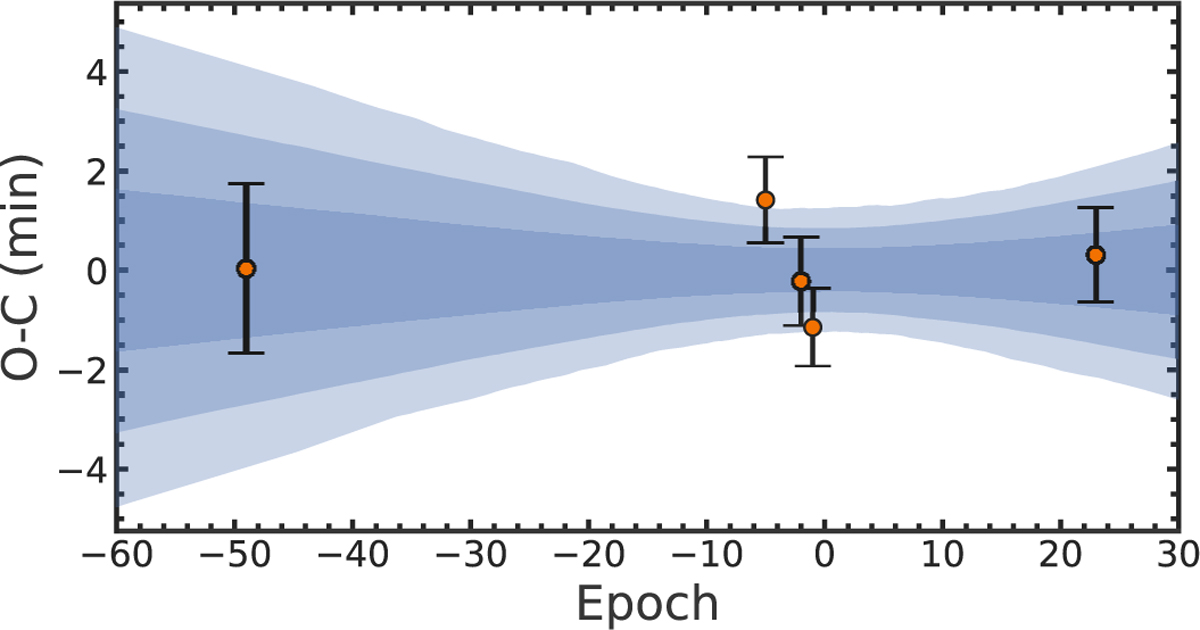
Observed minus calculated transit mid-times by linear ephemeris. The blue regions, from inner to outer, represent the propagation of ±1σ, ±2σ, and ±3σ errors associated with the calculated orbital period. No statistically significant TTVs are detected at levels of ±2σ.
Current usage metrics show cumulative count of Article Views (full-text article views including HTML views, PDF and ePub downloads, according to the available data) and Abstracts Views on Vision4Press platform.
Data correspond to usage on the plateform after 2015. The current usage metrics is available 48-96 hours after online publication and is updated daily on week days.
Initial download of the metrics may take a while.