Fig. 1
Download original image
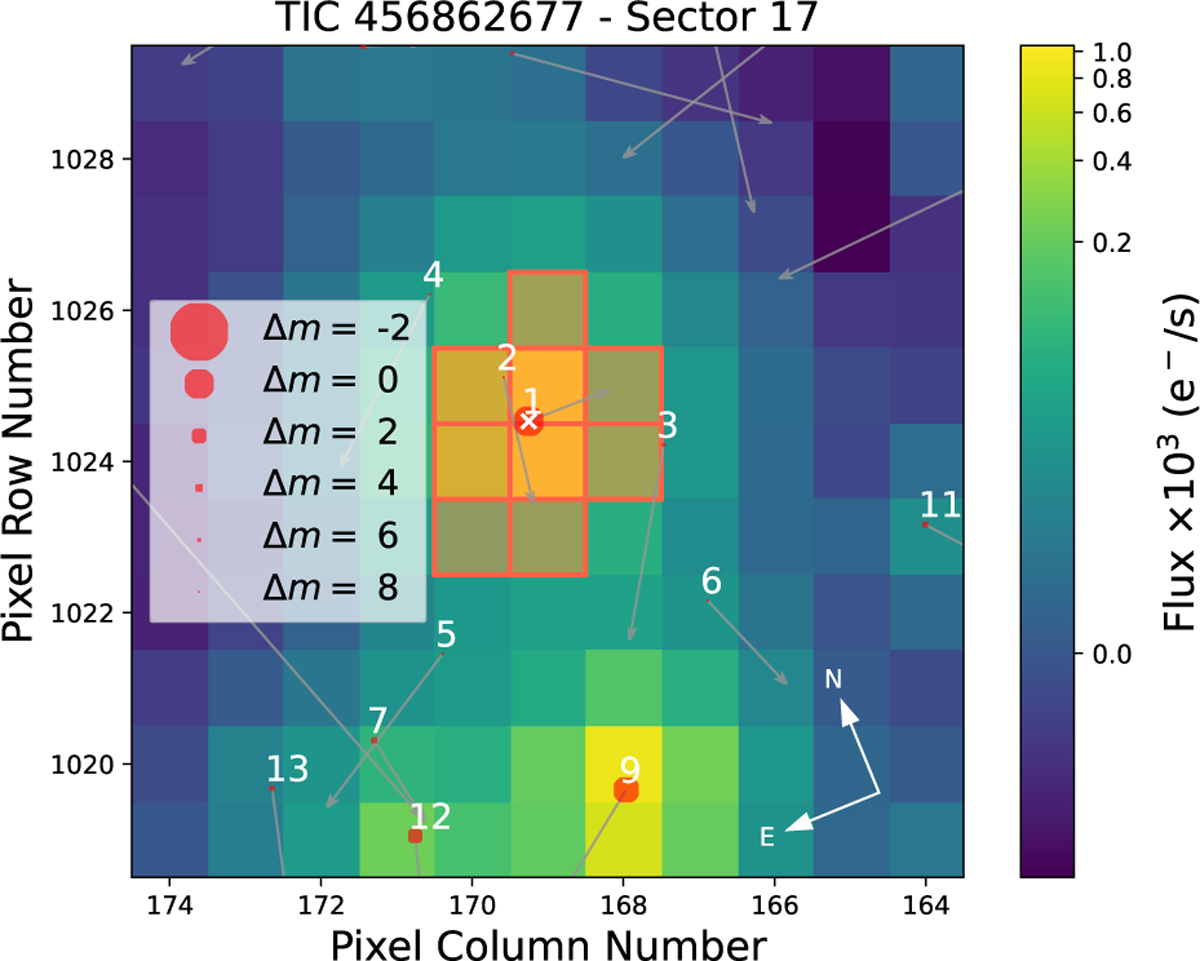
TESS TPF of Sector 17 for TOI-4515. The color bar indicates the electron counts for each pixel. The orange squares show the pixels selected to obtain the aperture photometry by the TESS pipeline. All the sources in Gaia DR3 are overplotted and represented with circles of different sizes according to the G-mag difference with respect to our target (see the legend); this was done with the tpfplotter code (Aller et al. 2020). Gray arrows indicate the direction of the proper motions for all the sources in the plot.
Current usage metrics show cumulative count of Article Views (full-text article views including HTML views, PDF and ePub downloads, according to the available data) and Abstracts Views on Vision4Press platform.
Data correspond to usage on the plateform after 2015. The current usage metrics is available 48-96 hours after online publication and is updated daily on week days.
Initial download of the metrics may take a while.