Fig. A.1
Download original image
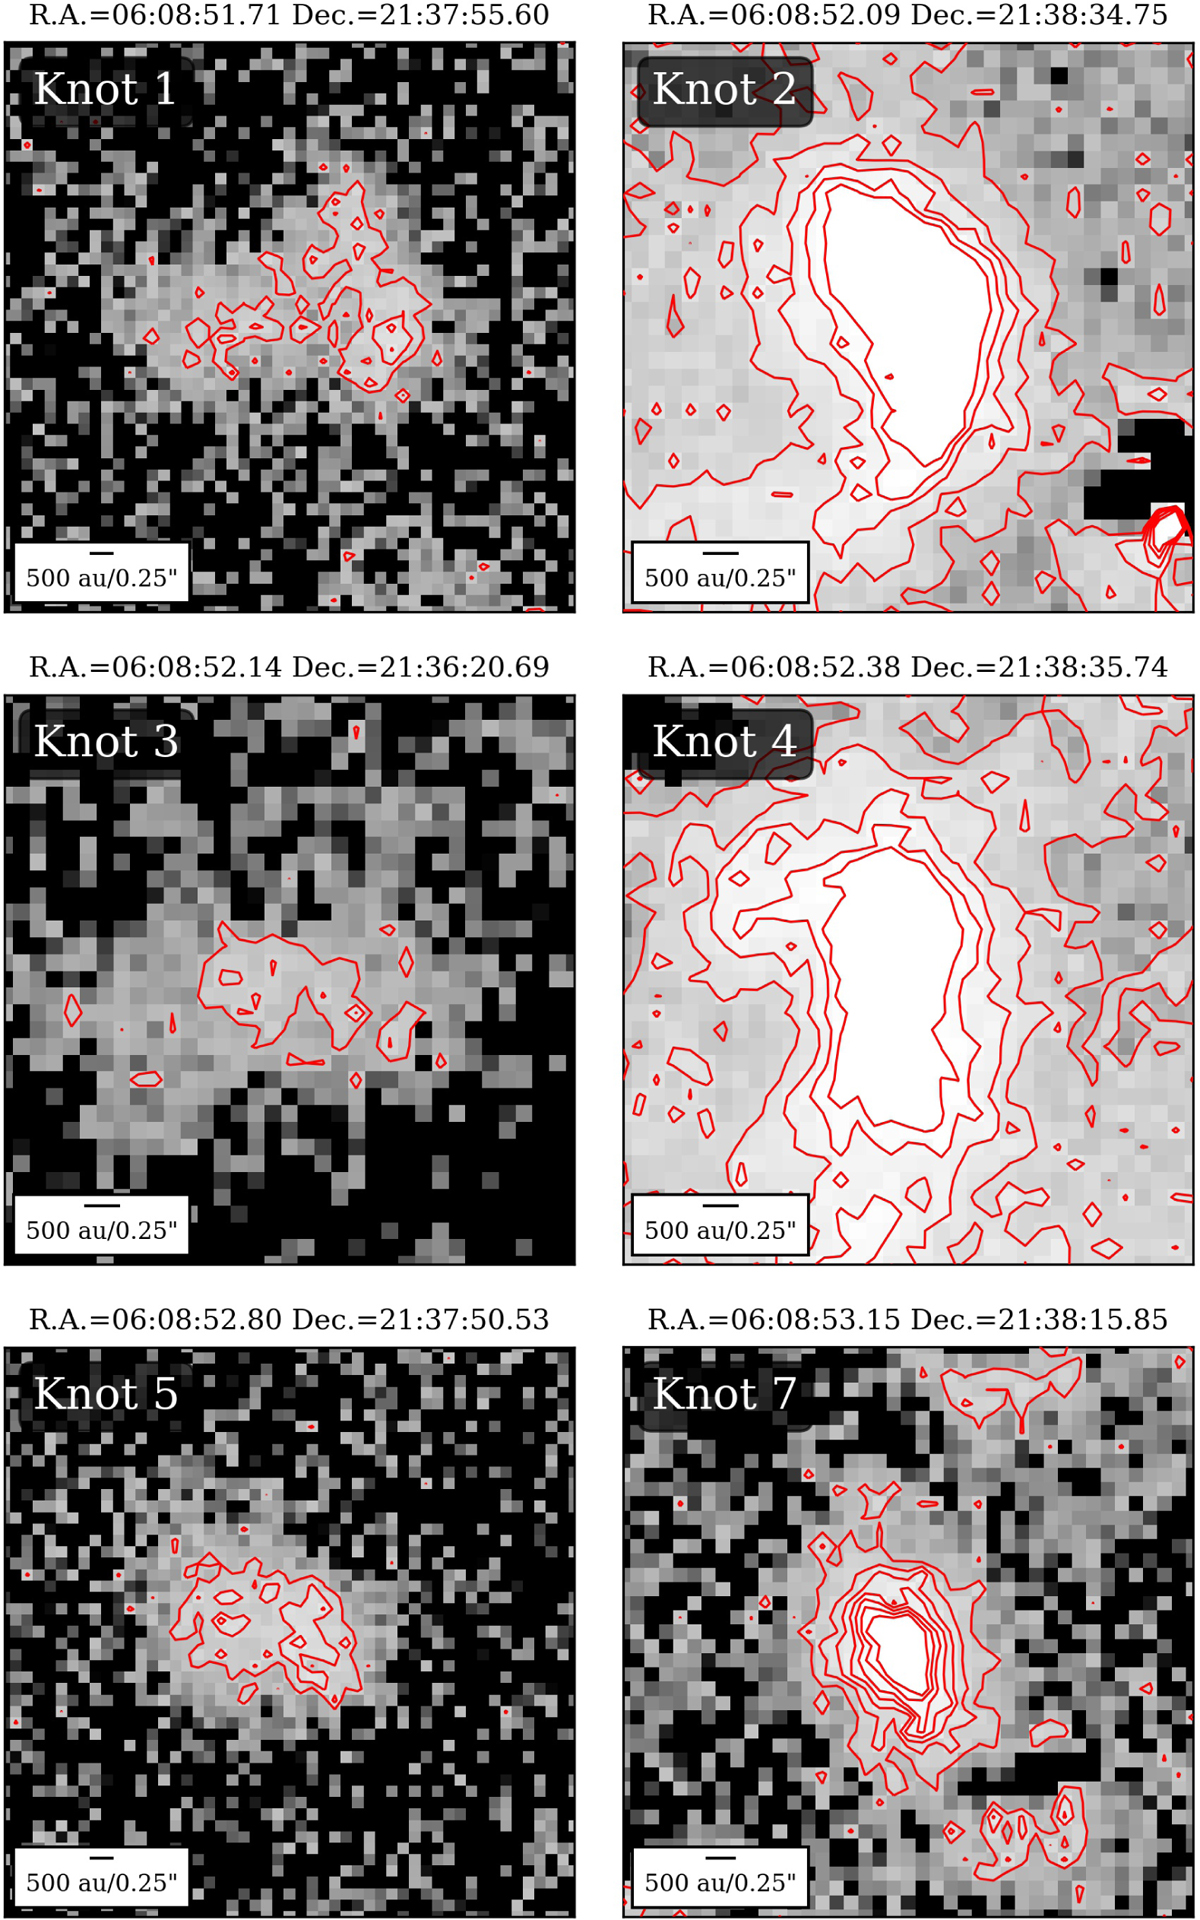
Significance level contour maps of all knot features identified in the LBT seeing-limited continuum-subtracted H2 image and compiled in Table 3. The contour levels shown represent 3 to 15σ in steps of 2σ above the local background. The central coordinates of each knot determined by 2D Gaussian fitting are given on the top of each panel. A physical scalebar of 500 au is given in the bottom-left corner of each panel. North is up and east is to the left in all panels.
Current usage metrics show cumulative count of Article Views (full-text article views including HTML views, PDF and ePub downloads, according to the available data) and Abstracts Views on Vision4Press platform.
Data correspond to usage on the plateform after 2015. The current usage metrics is available 48-96 hours after online publication and is updated daily on week days.
Initial download of the metrics may take a while.