Fig. 7
Download original image
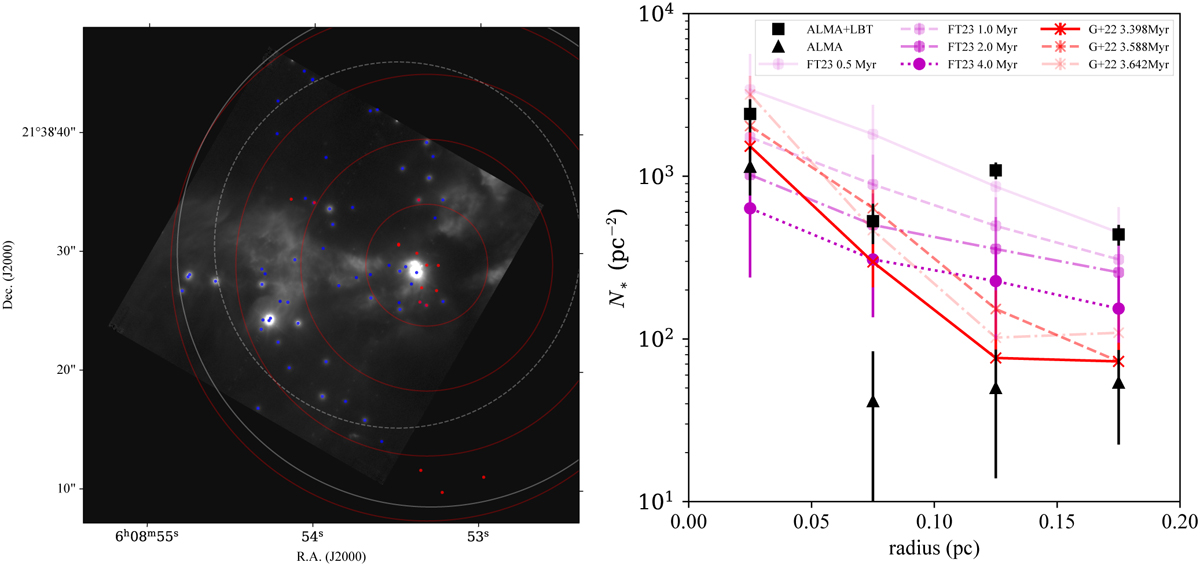
Massive protostar companion YSO surface number density analysis. Left: K-band LUCI-1 SOUL AO image of the central region of AFGL 5180. NIR sources are shown as blue dots and ALMA sources as red dots. ALMA FOVs for Bands 6 and 7 are shown as white solid and dotted circles, respectively. Annuli in which stellar surface densities have been sampled are shown as red circles. Right: radial surface number densities derived from the NIR + ALMA (black squares) and ALMA-only (black triangles). Poisson uncertainties are indicated by the error bars. Data from the STARFORGE simulation (Grudić et al. 2022) is shown by the red lines and symbols, as labeled (see text). Turbulent Clump model of protocluster formation from Farias & Tan (2023) is shown by the purple lines and symbols, as labeled (see text).
Current usage metrics show cumulative count of Article Views (full-text article views including HTML views, PDF and ePub downloads, according to the available data) and Abstracts Views on Vision4Press platform.
Data correspond to usage on the plateform after 2015. The current usage metrics is available 48-96 hours after online publication and is updated daily on week days.
Initial download of the metrics may take a while.